Cardano Price Analysis: ADA Targets $0.43 Breakout as Key Support Holds

Cryptocurrency trading is speculative and your capital is at risk when you trade. We may earn affiliate commissions from some of the products on this page - at no extra cost to you.

Highlights:
- The Cardano price is building momentum, trading above the key support zone at $0.39.
- On-chain data shows selective whale accumulation despite the declining social dominance.
- The technical outlook indicates a potential surge to the $0.43- $0.47 resistance levels.
On Tuesday, Cardano (ADA) is trading above the critical support level of $0.39, with bulls building momentum. The accumulation of whale positions indicates interest, whereas the decreased social dominance indicates an ambivalent mood. Technically, the ADA is in a critical zone. A hold above the support implies a new upswing in price, and a close below the support implies a more significant correction.
Advertisement

Supply-Distribution data from Santiment support an optimistic view of Cardano, as some whales have been buying ADA during recent price downturns. The measure indicates that whales holding 10 million to 100 million ADA tokens (blue line) have received 180 million ADA tokens between January 8 and Tuesday. At the same time, another whale holding between 1 million and 10 million ADA (yellow line) and 100,000 and 1 million ADA (red line) lost a total of 50 million ADA.
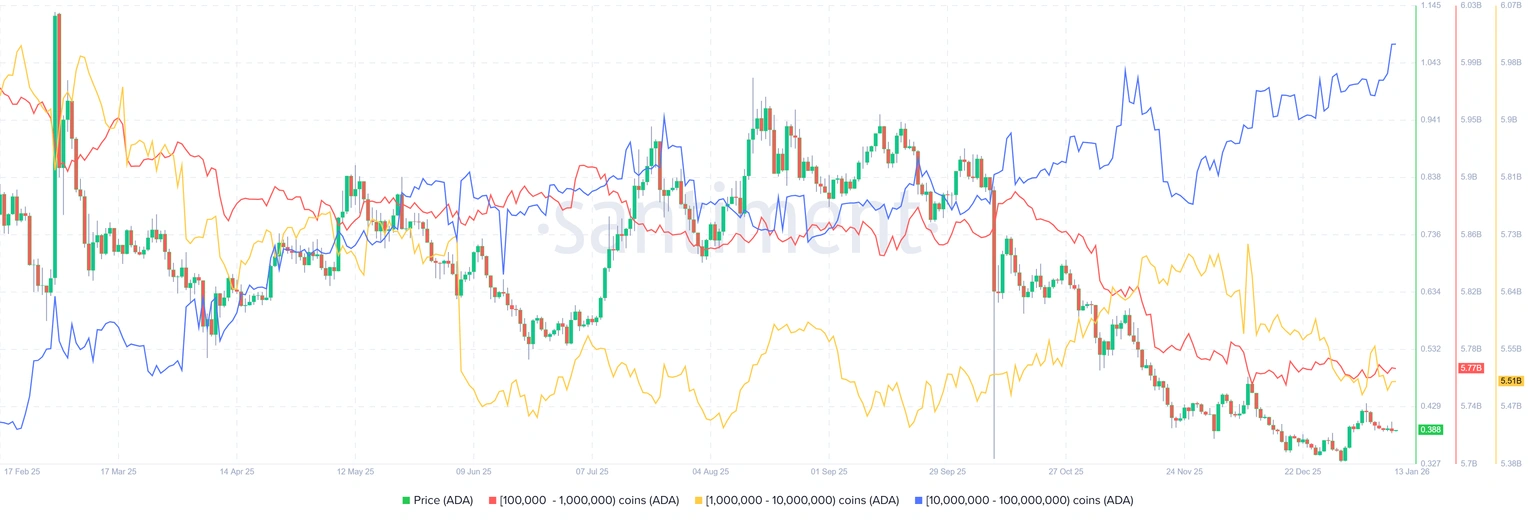
This indicates that the second group of whales may have succumbed to a capitulation event. By contrast, the initial group of wallets took the opportunity and received Cardano at a discount. On the other hand, according to Santiment data, ADA ranks last in the crypto media discourse, at 0.037%. This marks the lowest share since the beginning of December, and the share has also fallen since the beginning of January.
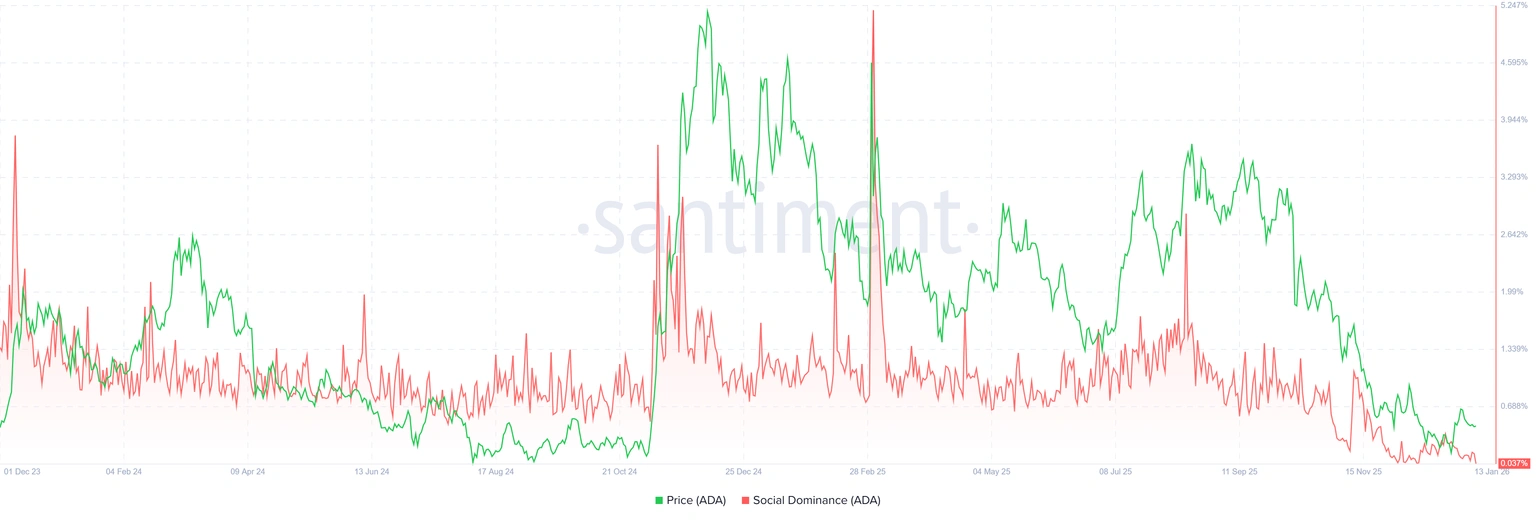
This deterioration reflects a loss of investor interest and reduced speculation, which is typically accompanied by lower demand and less near-term price momentum.
Cardano Price Targets $0.43-$0.47 Resistance Zones
The 1-day chart for ADA/USDT indicates a potential breakout if the $0.3959 support zone holds. The price recently dipped to $0.32 before staging a solid rebound and is currently hovering around $ 0.3979. The 50 SMA (Simple Moving Average) on the daily chart at $0.3959 is acting as a support zone, while the 200 SMA (blue line) at $0.64 suggests a long-term resistance zone in the ADA market.
The Relative Strength Index (RSI) at 52.55 is neutral, indicating there is a tight tug-of-war among the bulls and the bears. However, its position above the 50-mean level tilts the odds in favour of buyers. Meanwhile, the Moving Average Convergence Divergence (MACD) indicates a bullish crossover, with the MACD line (blue) crossing the signal line (orange).
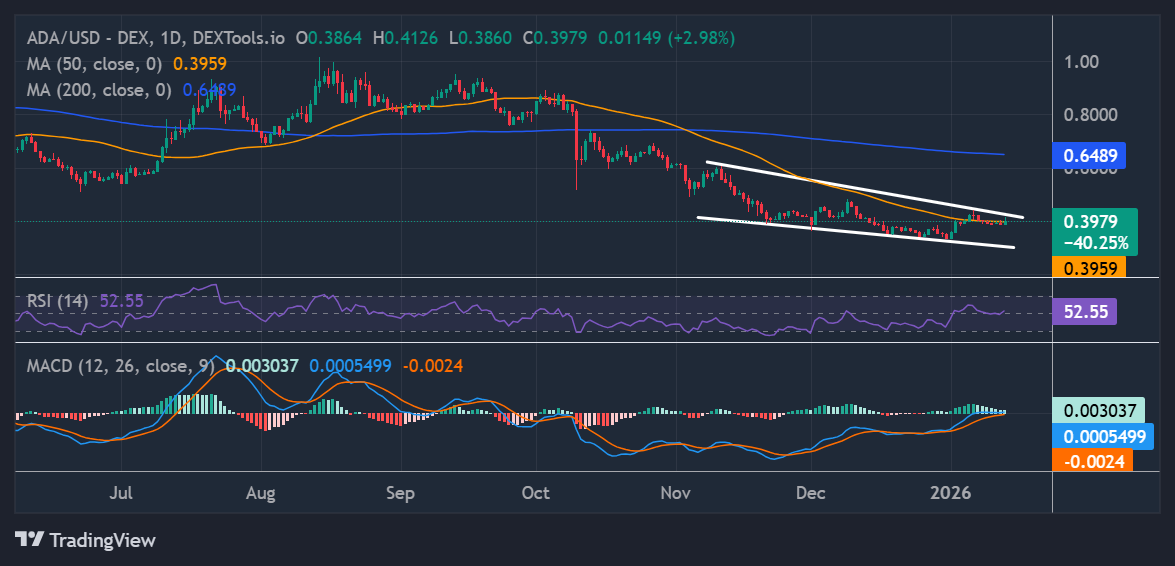
Looking ahead, the chart highlights a resistance range of $0.43 to $0.47. If ADA surges above $0.47, it could move toward the $0.64 resistance level if bulls continue to push.
Conversely, if the ADA bears stage a campaign, the Cardano price might fall back to the $0.3959 level. A drop below this point risks a slide to $0.32 safety net. Overall, in the short term, ADA may test the $0.43- $0.47 resistance level, and a break above with strong volume could trigger a rally. In the long term, whale accumulation and bullish technical indicators could push ADA to new highs.
![]()
eToro Platform
Best Crypto Exchange
- Over 90 top cryptos to trade
- Regulated by top-tier entities
- User-friendly trading app
- 30+ million users
![]()
eToro is a multi-asset investment platform. The value of your investments may go up or down. Your capital is at risk. Don’t invest unless you’re prepared to lose all the money you invest. This is a high-risk investment, and you should not expect to be protected if something goes wrong.
Advertisement


