Shiba Inu Price Prediction: SHIB Risks Further Downside as Bearish Momentum Builds

Cryptocurrency trading is speculative and your capital is at risk when you trade. We may earn affiliate commissions from some of the products on this page - at no extra cost to you.

Highlights:
- The Shiba Inu price has decreased by 3% to trade at $0.0000075 today.
- On-chain data shows whales offloading SHIB as its open interest slips by 3%.
- The technical outlook is bearish, as the SHIB price risks further downside to $0.0000073-$0.0000069.
Shiba Inu (SHIB) price is facing renewed selling pressure, tumbling 3% to trade at $0.0000075 today. The bearish mood is also reinforced as holders sell SHIB further, and the Open Interest (OI) in the derivatives market decreases. At the technical level, the decrease in momentum indicates that the pressure against the meme coin on the downside may dominate.
Advertisement

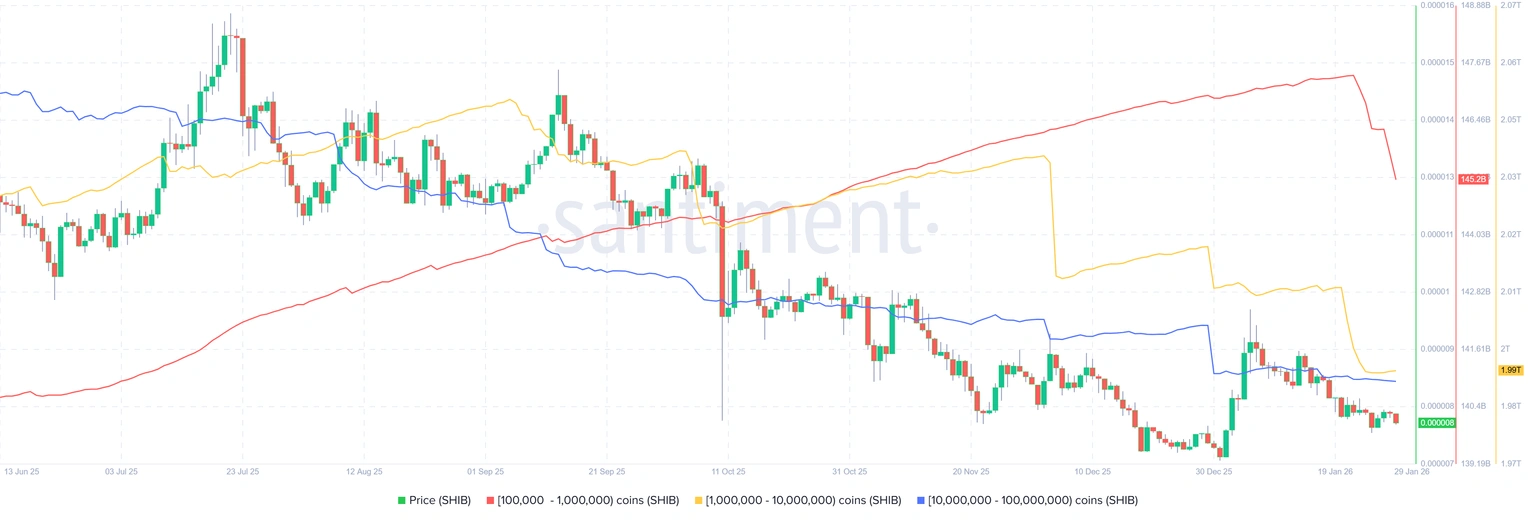
Santiment Supply Distribution shows that the large-wallet holders of Shiba Inu are on a downward trend, and it is a bearish sign. The measure shows that the whales with the number of 100,000 to 1 million (red line), 1 million to 10 million (yellow line), and 10 million to 100 million (blue line) have lost a total of 32.17 billion SHIB tokens. This is between January 20 and Thursday, which has added to the selling pressure.
On the derivatives side, SHIB futures Open Interest (OI) has slipped to $91.76 million on Thursday, and it has been steadily declining since the January 6 peak of $145.56 million. This decline in OI indicates the declining investor involvement and gives a negative forecast.
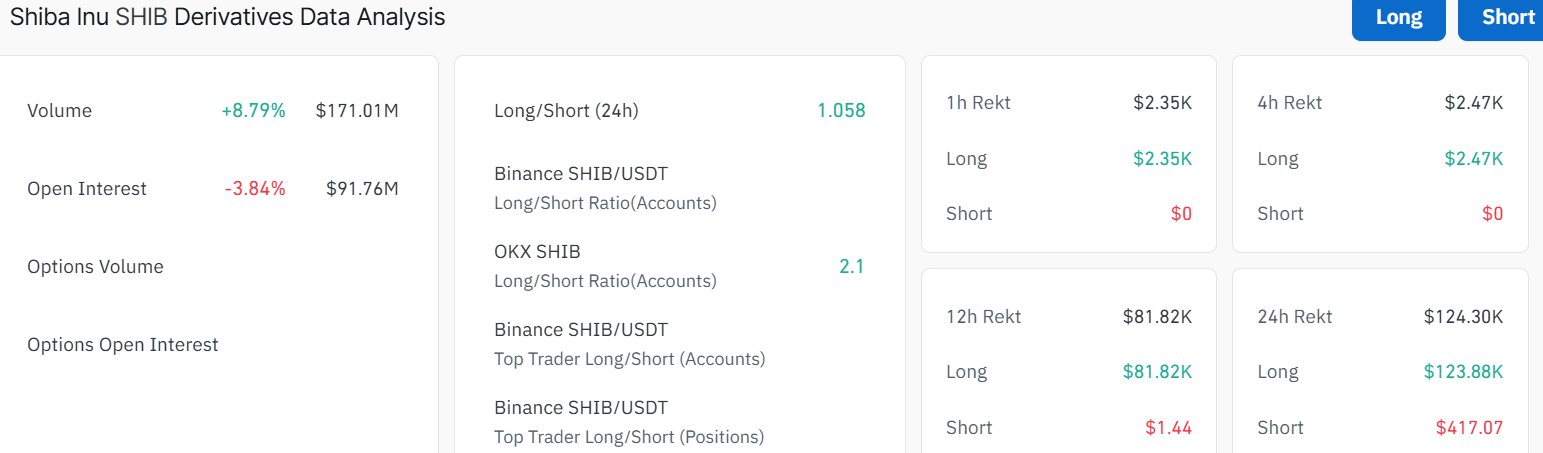
Meanwhile, the volume has risen by 8% to $171.01 million, indicating heightened trading activity. Moreover, the long-to-short ratio is at 1.058, showing that the longs are paying the shorts. However, the recent drop in open interest shows that money is flowing out of the SHIB market, which may cause a price drop.
SHIB Risks Further Downside As Bearish Grip Mounts
The memecoin is resting below both moving averages, signalling intense selling pressure in the market. Currently, the Shiba Inu price is exchanging hands at $0.0000075, with a possible downside.
Key technical indicators signal caution but not panic at the moment. The RSI (Relative Strength Index) is at 41.87, showing that the coin is approaching oversold territory. If RSI drops near 30, buyers may soon return and rekindle the buying appetite. Notably, the MACD (Moving Average Convergence Divergence) is negative, with the orange signal line slightly above the blue. This points to slowing momentum, but not a deep crash in SHIB.
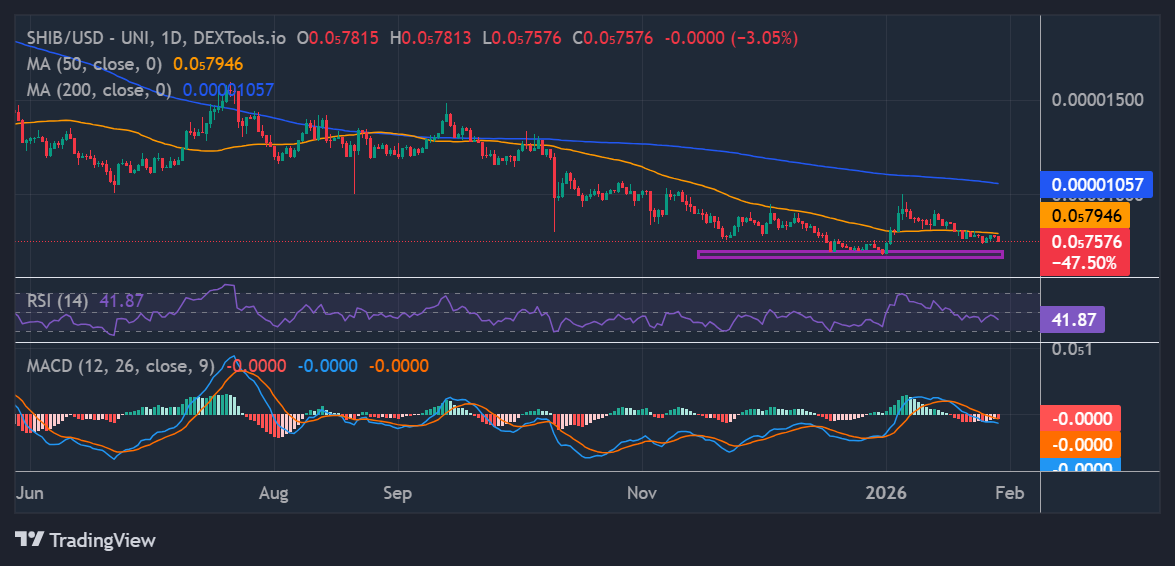
The 50-day SMA (Simple Moving Average) now sits at $0.0000079, while the 200-day SMA remains at $0.000010. SHIB is trading below both SMAs, suggesting the trend is wobbling, and bears may target further downside towards $0.0000069.
The current price action is towards the support area at $0.0000069. If buyers defend this support, a rebound to test resistance at $0.0000079 is possible. A push above this resistance could open the door to $0.0000094-$0.000010, which aligns with the long-term resistance (200-day SMA).
However, if sellers keep dominating, the SHIB price could drop quickly to $0.0000073 or even $0.0000069, where the next major buying zones sit. For now, if support holds and bulls regain strength, the meme coinmay finally bounce back.
![]()
eToro Platform
Best Crypto Exchange
- Over 90 top cryptos to trade
- Regulated by top-tier entities
- User-friendly trading app
- 30+ million users
![]()
eToro is a multi-asset investment platform. The value of your investments may go up or down. Your capital is at risk. Don’t invest unless you’re prepared to lose all the money you invest. This is a high-risk investment, and you should not expect to be protected if something goes wrong.
Advertisement


