Cate Price Jumps 20%, Gaining Traction Through Rapid Community Expansion and Increased Market Presence


The Cate price has surged 20% in the last 24 hours to trade at $0.03447 as of 3:42 a.m. EST. Trading volume has increased by 11% to $25 million, with the market cap now at $34 million.
Cate, a relatively new meme coin on the Ethereum blockchain, has been experiencing rapid growth despite its smaller market cap. Within a short period, Cate has seen significant price increases, surging by 68% over the last day and a half.
Advertisement

$cate
Please take a look at this healthy price movement.
We are on the verge of a massive rise. 🔥I personally think that $200M MC is definitely possible by the end of the month. Let's see.
It's all about the cat with an ‘e’
Study it 🤝@cateonethereum #memecoin #cate #doge pic.twitter.com/upsEyR4bp8— JWT (@hodlandgo) September 18, 2024
In just three days, Cate Coin has attracted over 5,500 holders. Its social media presence is also expanding, with around 4,600 Twitter followers and a growing number of exchange listings.
Cate’s early achievements include a $20,000 donation to Perry’s Place LA, a cat shelter, highlighting the team’s commitment to making a positive real-world impact. The project has also garnered attention for its fast-growing community, which boasts over 5,000 Telegram members, Twitter verification, and increasing exchange listings. With its strong early performance, the coin shows great potential for further growth.
Cate Statistics
- Cate price: $0.03447
- Market cap: $34 million
- Trading volume: $25 million
- Circulating supply: 1 billion
- Total supply: 1 billion
Cate Price Bulls Gear Up for a Bullish Breakout Aboive the Bearish Channel
The Cate price has recently experienced a downward trend, signaling that bears still control the market. This is all about to change since the steady downward trend has led to a bearish channel, indicating an upcoming bullish trend. The bulls have regained momentum due to the increase of Cate’s price from the $0.02578 support level; this has brought hope for a bullish breakout at the upper trend line of the bearish channel.
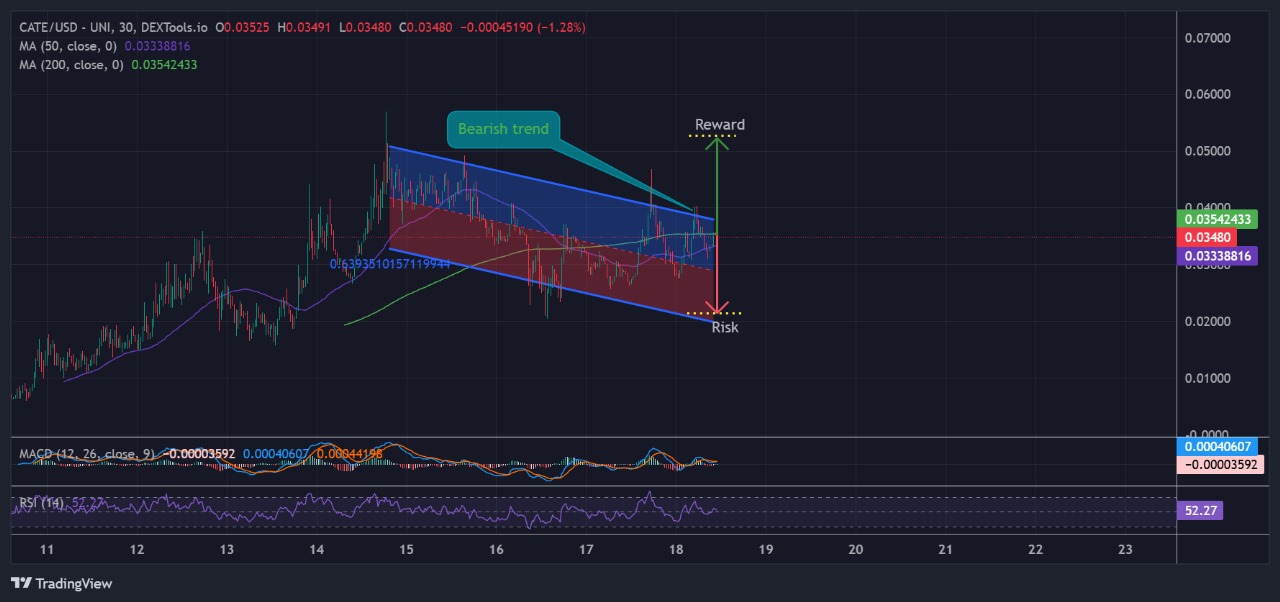
The price trades above the 50-day simple moving average (SMA) at $0.03338, indicating a positive shift in the short-term trend. This level now acts as potential support, which could protect against short-term pullbacks. Cate’s price is currently on track to surpass the 200-day SMA, which, after a successful cross-over, will support and further confirm the bullish trend.
Technical Indicators Signal Potential Bullish Breakout
The relative strength index (RSI) is at 52.27, suggesting neutral conditions. This means the price is neither overbought nor oversold, leaving room for further upside movement without the immediate threat of a correction. When bulls fully control the price, the RSI will aim to cross over the 70-overbought mark.
Additionally, the moving average convergence divergence (MACD) supports the possibility of a bullish breakout. The red histogram bars decrease in size and number as they fade out in color. On the other hand, the blue line of MACD rises to cross above; this signals the shift from a bearish to a bullish trend.
The bulls are showing strength by driving the price from the support level, targeting a bullish breakout at the upper end of the bearish trend. If the price breaks above the upper boundary of the descending channel and moves past the resistance level, it could trigger a bullish move toward the next target of around $0.0529 (reward).
However, if it fails to break through the resistance, the price may retest the support zone near $0.020 (risk). Watch for a breakout signal to confirm a bullish reversal, especially if supported by MACD and RSI.
Advertisement


Charles Kibue
Charles Kibue is a cryptocurrency researcher and writer with published works on Crypto2Community and a range of other sites. He has also worked as a technical writer, researching NFTs and crypto projects. Charles is an English Literature graduate residing in Kenya. He possesses additional expertise in market analysis and offers accurate and reliable insights, staying up-to-date with the latest developments in the crypto industry. Beyond his professional pursuits, Charles enjoys hiking and horse riding in his leisure time.
View full profile ›ℹ️About Crypto2Community's Editorial Process
Crypto2Community's editorial policy is centered on delivering thoroughly researched, accurate, and unbiased content. We uphold strict editorial policy and sourcing standards, and each page undergoes diligent review by our team of top crypto industry experts and seasoned editors. This process ensures the integrity, relevance, and value of our content for our readers.


