


XRP has experienced a slight downturn in the past day following the market corrections. The price is hovering near the support levels, indicating a bearish trend. At the time of writing, XRP is currently at $0.476, having decreased 1.81% during the U.S. trading session.
The current market capitalization is approximately $26.5 billion, ranking it seventh among all cryptocurrencies. The trading volume over the past 24 hours has increased significantly by 22.26%, reaching over $1.03 billion. This heightened activity suggests investor response to the price movement and the broader market conditions affecting XRP.
Advertisement

Potential Drop or Recovery on the Horizon?
Over the past week, XRP has faced a slight decline of 2%, continuing its gradual downward trend. This week’s trading saw XRP prices oscillate narrowly, reflecting an ongoing standoff between buyers and sellers.
Currently, many digital currencies are exhibiting declines, marked by red candlesticks on trading charts. Bitcoin has fallen below the $61,000 mark, and Ethereum is trading under $3,300, which has influenced other cryptocurrencies, including XRP.
XRP has dropped by 10% in the last month, with prices wavering between $0.52 and $0.46. This narrow price range highlights the ongoing struggle for market dominance. Over this period, XRP has shown a declining trend, signaling bearish market conditions.
Ripple’s Ongoing Battle with the SEC And Whale Movements
XRP Lawsuit: Ripple is currently advocating for lenient penalties and injunctions, while former SEC attorneys maintain that the remedies phase favors the SEC. These attorneys have also clarified the Supreme Court’s Chevron decision’s impact on SEC vs. Ripple and similar cases.
2/ deference to the SEC. Hence in issuing her (mixed) SJ ruling in Ripple, Judge Torres did not defer to the SEC. So the elimination of Chevron deference has no bearing on this case. Nothing has changed.
— Marc Fagel (@Marc_Fagel) July 2, 2024
Ex-SEC lawyer Marc Fagel recently explained on social platform X that the Supreme Court’s Chevron deference impacts government agency rulemaking but does not extend to SEC enforcement practices. In situations where laws are vague, courts tend to rely on agency interpretations.
Meanwhile, significant XRP transfers to cryptocurrency exchanges have been noted. Commentator MartyParty highlighted on X that since July 1st, over 63 million XRP have been moved to trading platforms.
$XRP Whale🐳Trades continue: 63,570,000 $XRP sent to exchanges @Bitstamp and @Bitso – from experience you dont store crypto on these exchanges you sell it. 👀https://t.co/3bjVlri3knhttps://t.co/QITbdY8xk4#XRP #Ripple @Ripple pic.twitter.com/gjOdJluRnq
— MartyParty (@martypartymusic) July 2, 2024
This substantial transfer indicates possible market fluctuations, as large holders, often called whales, might be preparing for a shift in XRP’s price.
Technical Indicators and Future Outlook
Investors are paying close attention to the crucial support level at $0.45 for XRP. If bearish trends persist, the XRP price might see a dip to $0.44. A continued downturn could lead the price further down to $0.4, signaling a broader market retreat. Such a drop would represent a significant shift in the market landscape.
On the flip side, a market rebound from this level could propel XRP’s price to $0.5 within a week. Surpassing this resistance level could set the stage for a rally towards $0.8. Moreover, with sustained bullish momentum, there’s potential for XRP to reach $1 during the next upward trend.
The technical indicators for XRP/USD show a downward trend, as observed on the daily chart. The Relative Strength Index (RSI) is at 36, indicating that the asset is neither overbought nor oversold. The Moving Average Convergence Divergence (MACD) shows a bearish crossover.
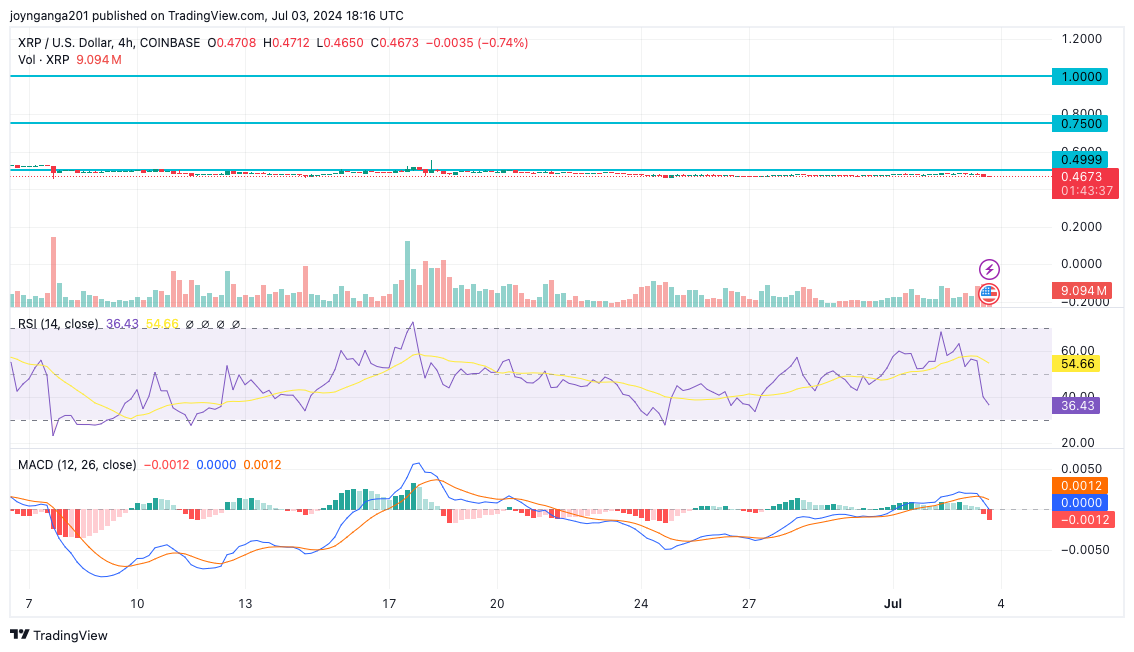
The MACD line below the signal line could suggest a potential for further declines if the trend continues. The price action has been predominantly bearish since a peak in March, with support possibly forming around the $0.45 mark.
Most of the moving averages for XRP indicate strong sell signals at the moment, with downward trends in the short term. The 20-Exponential moving average is below the 50-EMA, suggesting that the price momentum is declining.
Read More
- Next Cryptocurrency to Explode in July 2024
- Crypto Price Predictions
- Best Crypto Exchanges in 2024
- Can Chainlink (LINK) Double Its Value in the Coming Months? Here’s What this Expert is Saying


Advertisement


