Litecoin Price Slides 2% as the Open Interest Slips, LTC Bears Target $50

Cryptocurrency trading is speculative and your capital is at risk when you trade. We may earn affiliate commissions from some of the products on this page - at no extra cost to you.

Highlights:
- Litecoin price has dropped 3% to trade at $54 today.
- The LTC derivatives data show weakening retail demand, as the open interest slips by 2%.
- The technical outlook shows growing bearish pressure, as the LTC bears target $50.
Litecoin price trades in the red, currently exchanging hands at $54, marking a 2% today. Meanwhile, the weak derivatives data signal a bearish position, as the open interest and the long-to-short ratio flip negative. Notably, the technical analysis indicates a further correction in the near future, towards the $50 support zone.
Advertisement

Litecoin Derivatives Market Shows Weakening Demand
The futures Open Interest (OI) of Litecoin has dropped by 2.30% to $340 million. On the other hand, the volume has also decreased by 1.09% to $304 million, indicating a drop in market activity. This outlook shows weakening retail demand, as money is flowing out of the LTC market, strengthening the bearish movement.
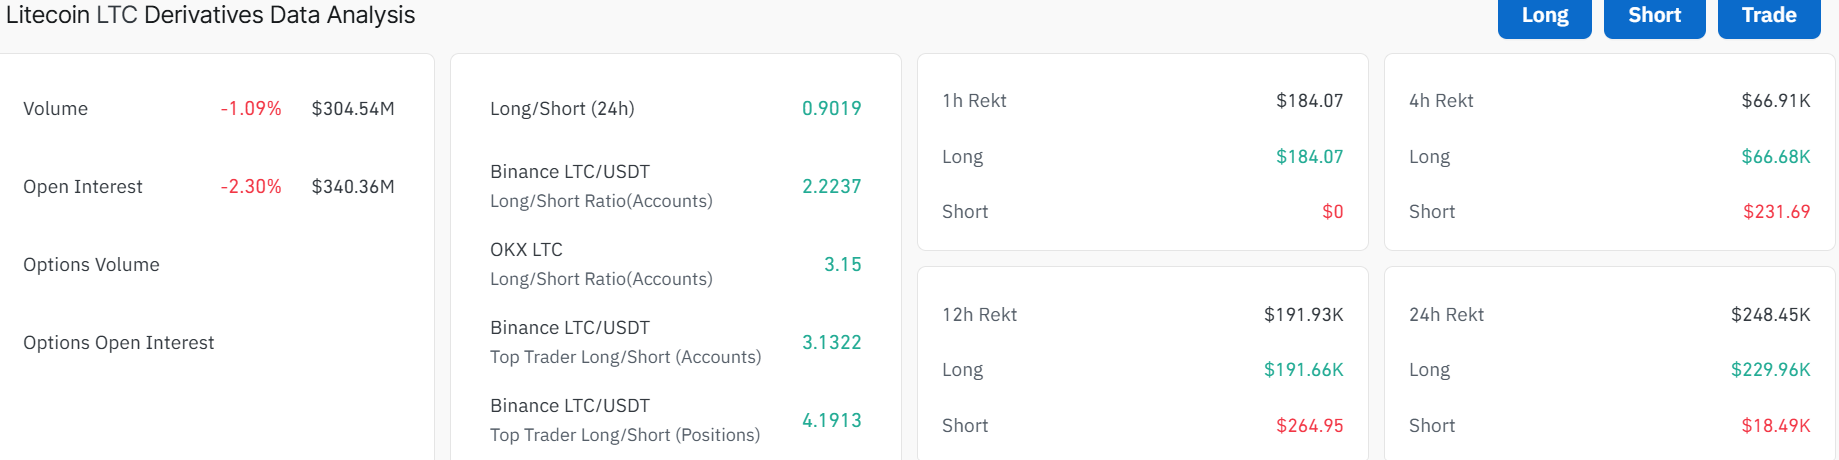
Moreover, LTC’s long-to-short ratio on CoinGlass stands at 0.90 today, tilting the odds towards the bears. This ratio is less than one, indicating a bearish mood in the markets, with more traders betting against the asset price.
LTC Bears Target $50 Support Zone as Bearish Sentiment Builds
The Litecoin price chart shows the coin is struggling to recover from a quick drop below key support zones. It is trading just at $54, with the 50-day Simple Moving Average (SMA) at $54.58 acting as the overhead resistance zone. Meanwhile, the 200-day SMA at $81 acts as a long-term ceiling if the price tries to bounce up.
Currently, the Litecoin price is trading well within a consolidation channel. The short-term support is found near $50, but a stronger area sits around $45, where buyers last stepped in. The daily chart shows a major resistance band between $54 and $81. If the price manages to climb above the moving averages, there is a chance for a move back towards $90.
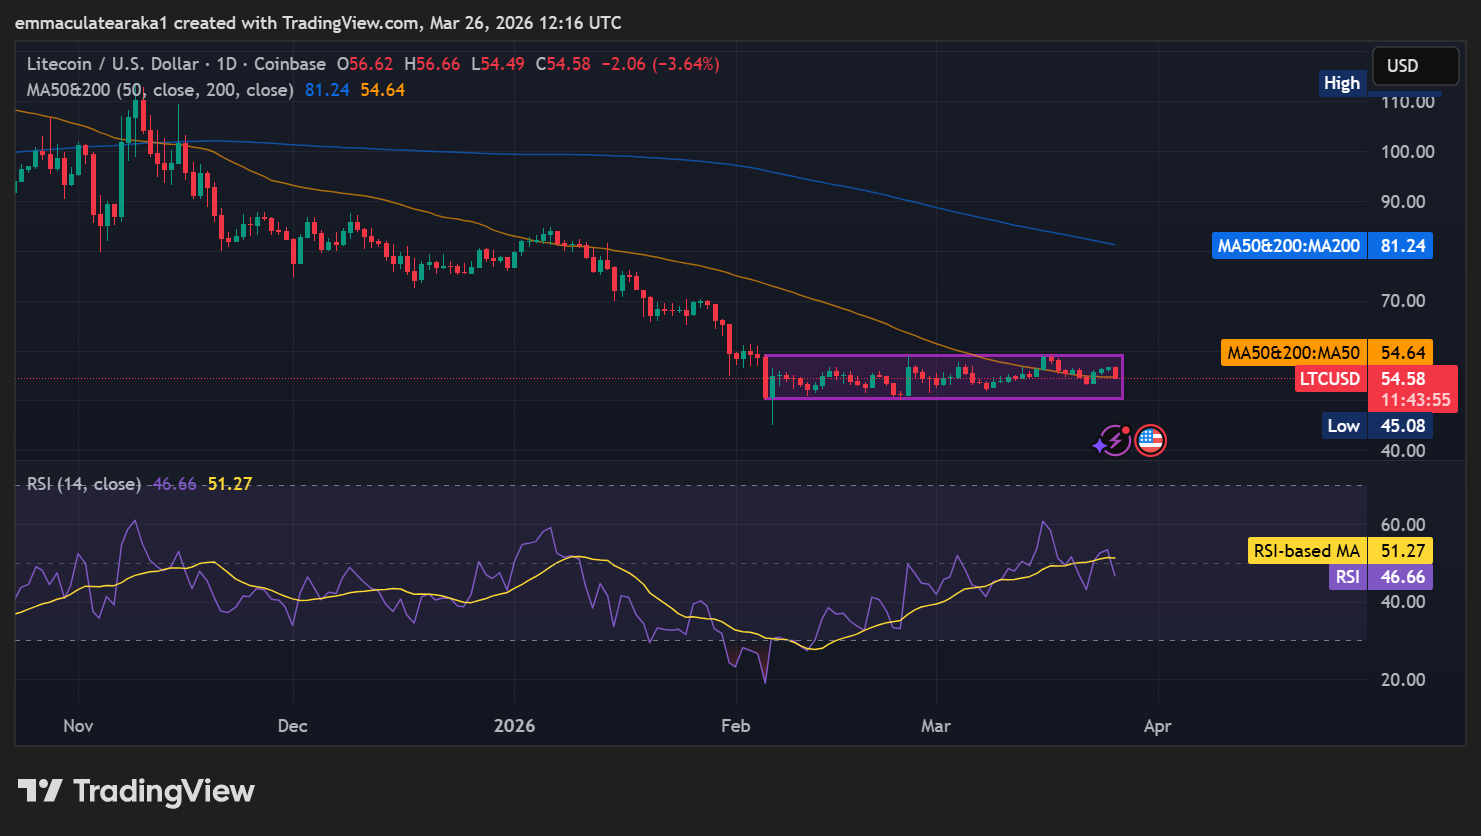
Meanwhile, the technical indicators are showing a bearish bias. The Relative Strength Index reads 46.66, which is below the RSI-based MA at 51.27. This suggests the market is mixed, with the bears having the upper hand. This means a short-term rebound could happen if buyers return. However, sellers are still in control, and the MACD indicator is flat and negative, showing little momentum for an upward push.
If LTC continues with the downward movement, a test of the $50 region is likely. Below $50, the next support is much lower, near $45. On the upside, clearing resistance at $54.64, aligning with the 50-day SMA, could initiate a short-term rebound.
In the meantime, the Litecoin price faces short-term headwinds reinforced by the negative derivative data and bearish outlook. However, if support levels hold and the 50-day SMA gives way, a rebound towards $59.82 remains possible in the next few days. For now, the crypto market is shaky, as there is uncertainty over the US-Iran cease-fire deal. This has seen the crypto market, led by BTC, plunge towards the $69,000 mark. Traders should watch the momentum indicators cautiously to determine the next move in LTC.
![]()
eToro Platform
Best Crypto Exchange
- Over 90 top cryptos to trade
- Regulated by top-tier entities
- User-friendly trading app
- 30+ million users
![]()
eToro is a multi-asset investment platform. The value of your investments may go up or down. Your capital is at risk. Don’t invest unless you’re prepared to lose all the money you invest. This is a high-risk investment, and you should not expect to be protected if something goes wrong.
Advertisement


