


Highlights:
- Ethereum ETFs recorded another day of concerning outflows.
- Bitcoin ETFs record four consecutive days of consistent inflows.
- BTC records more greens in price changes across specific periods than ETH, which recorded more reds.
In recent Exchange Traded Funds (ETFs) flow data, Ethereum (ETH) ETFs have sustained outflow trends. Similarly, Bitcoin (BTC) ETFs maintained consistent inflows. The latest statistics implied that Ethereum recorded four consecutive days of outflows. On the other hand, Bitcoin has sustained inflows for four straight days.
Advertisement

Considering ETH ETFs’ unimpressive sales trends, there have been significant concerns about the possible price implications. However, the Ethereum ETFs are still in their early trading phase, implying that hope about a spontaneous turnaround still abounds. Additionally, out of ETH’s nine ETFs, only one has consistently registered significant outflows, underscoring massive trend reversal tendencies.
On the contrary, Bitcoin’s sustained positive netflows have positively impacted Bitcoin’s price actions. The flagship cryptocurrency has been recording gradual price ascents, culminating in almost breaking above $70,000 at some points. Like Ethereum, only one BTC ETF has consistently recorded outflows, invariably implying that the inflows could skyrocket following a reversal.
Ethereum ETFs Outflows Data
According to Lookonchain, Ethereum saw about 44,413 ETH, valued at about $147.9 million in net outflows. Grayscale Ethereum Trust (ETHE) registered the only outflows. The outflows were significant enough to cause a negative netflow. Notedly, ETHE witnessed 111,023 ETH outflows valued at about $369.7 million. The outflows reduced its assets under management (AUM) to 2,280,661 ETH, worth approximately $7.59 billion. Despite the significant outflows, and relative to other ETH ETFs, ETHE still has the most valuable AUM.
Meanwhile, the remaining eight Ethereum ETFs all recorded inflows, excluding 21Shares Core Ethereum ETF (CETH) with zero flows. iShares (BlackRock) Ethereum Trust (ETHA) witnessed the highest inflows with 26,667 ETH. Invesco Galaxy Ethereum ETF (QETH) saw the least with 4,532 ETH. Presently, Ethereum ETFs boast 2,917,317 ETH valued at about $9.71 billion.
Bitcoin ETFs Inflows Data
On its part, Bitcoin sustained its past few days’ inflows with $41.32 million from 601 BTC. Grayscale Bitcoin Trust (GBTC) recorded the only inflows with 623 BTC while still possessing 270,589 BTC as AUM. Other Bitcoin ETFs registered inflows, except Franklin Bitcoin ETF (EZBC), Valkyrie Bitcoin Fund (BRRR), Vaneck Bitcoin Trust (HODL), and ARK 21Shares Bitcoin ETF (ARKB), with zero flows.
Notably, iShares(Blackrock) (IBTC) witnessed the highest inflows among BTC ETFs, with 341 BTC valued at roughly $23.5 million. Following its relatively significant inflows, IBTC currently holds 338,470 BTC worth $23.28 billion. With the recent flow rates, BTC ETFs boast a significant 913,586 coin holdings valued at about $62.83 billion.
July 29 Update:
9 #Bitcoin ETFs
NetFlow: +601 $BTC(+41.32M)🟢#iShares(Blackrock) inflows 341 $BTC($23.5M) and currently holds 338,470 $BTC($23.28B).9 #Ethereum ETFs
NetFlow: -44,413 $ETH(-147.9M)🔴#Grayscale outflows 111,023 $ETH($369.7M) and currently holds 2,280,661… pic.twitter.com/HaTV6CXevp— Lookonchain (@lookonchain) July 29, 2024
Ethereum Sees Red in Price Changes Across Specific Periods
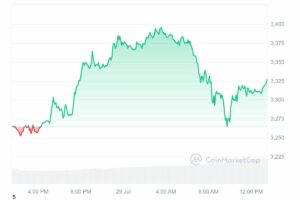
At the time of press, ETH is changing hands at about $3,315, reflecting a subtle 1.4% upswing in the past 24 hours. Notably, Ethereum’s current price indicates a 32.2% drop from its $4,878.26 peak price, which it attained in November 2021. In its 7-day-to-date, 14-day-to-date, and month-to-date variables, ETH recorded declines of roughly 4.5%, 2.3% and 2.0%.
Bitcoin Records More Greens than Reds in Specific Periods Price Changes
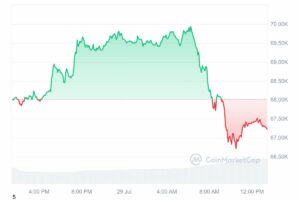
Contrary to Ethereum, BTC is down by 1.1%, trading at about $67,270. Its current selling price signifies that the flagship cryptocurrency is 8.8% below its all-time high (ATH), established in March 2024. BTC recorded spikes of price surges of about 6% and 10% in its 14-day-to-date and 30-day-to-date data, respectively. Finally, its 7-day-to-date index recorded a slight 1.1% drop.
Read More
- Next Cryptocurrency to Explode in July 2024
- Crypto Price Predictions
- Best Solana Meme Coins to Buy In 2024
- Andrew Left Pleads Not Guilty to Fraud Charges Over Short-Seller Calls
- SEC Adjusts Binance Lawsuit, Impacting SOL, MATIC Token Classification

Advertisement


