Cosmos Price Prediction: Will ATOM Reach $10 this Month Amid Bearish Trends?

Cryptocurrency trading is speculative and your capital is at risk when you trade. We may earn affiliate commissions from some of the products on this page - at no extra cost to you.

Cosmos has experienced a slight decline over the past 24 hours after a minor market correction. The ATOM price is currently hovering below the $6.00 level, indicating some market volatility. The token hovered at $5.81, with a 2.10% decrease during the European trading session.
The current market cap stands at $2.27 billion, ranking it at #33 among cryptocurrencies. The 24-hour trading volume has surged by 50.43%, reaching $178.21 million, suggesting increased market activity amidst the price fluctuation. The circulating supply remains at 390.93 million ATOM, with a fully diluted market cap also at $2.27 billion.
Advertisement

Is a Breakout Above $6 Soon?
The ATOM price fluctuated between $5.61 and $6.22 over the past 24 hours, reflecting the ongoing volatility in the cryptocurrency market.
ATOM is significantly down from its all-time high of $44.70, achieved on September 20, 2021, marking an 87.04% decline. However, the token remains up by 412.02% from its all-time low of $1.13, recorded on March 13, 2020.
The price movement over the last day shows a steep decline initially, followed by a partial recovery before another drop. The chart indicates that ATOM started trading at around $5.97 before dipping sharply to its lowest point of $5.61. After this dip, the price climbed to a peak of $6.22 but couldn’t sustain this level, falling back to its current price of $5.80.
Over the past week, ATOM price has seen a dip of 15%, trading in a range bound of $5.10 to $6.90. This decline can be attributed to a broader market correction affecting various cryptocurrencies and overall market sentiment.
Current Market Performance
Most of the cryptocurrencies today are trading in a sideways trend, with some experiencing recovery and others continuing to face selling pressure. Bitcoin is currently hovering above $56,000, with slight bearish indicators suggesting potential further consolidation.
Ethereum, on the other hand, has shown signs of resilience, maintaining its position around $2,900 despite the market turbulence
Resistance and Support Levels: What’s Next for ATOM?
Cosmos is currently encountering a significant resistance level at $6.00. If this barrier is surpassed, it may lead to a price surge of $7.00. Such a movement could pave the way for reaching the $10.00 mark, indicating a bullish trend in the next upward run.
However, increasing bearish pressure and market fluctuations may cause Cosmos to drop to a support level of $5.50. If the market sentiment turns negative, ATOM could fall further to $5.00. Sustained bearish momentum might confirm a downward trend.
The technical indicators for Cosmos (ATOM) reveal a mixed market. The Relative Strength Index (RSI) is presently at 42, below the neutral 50 mark, indicating that the asset is neither overbought nor oversold but is closer to the oversold territory. This could suggest a potential for upward movement if buying pressure increases.
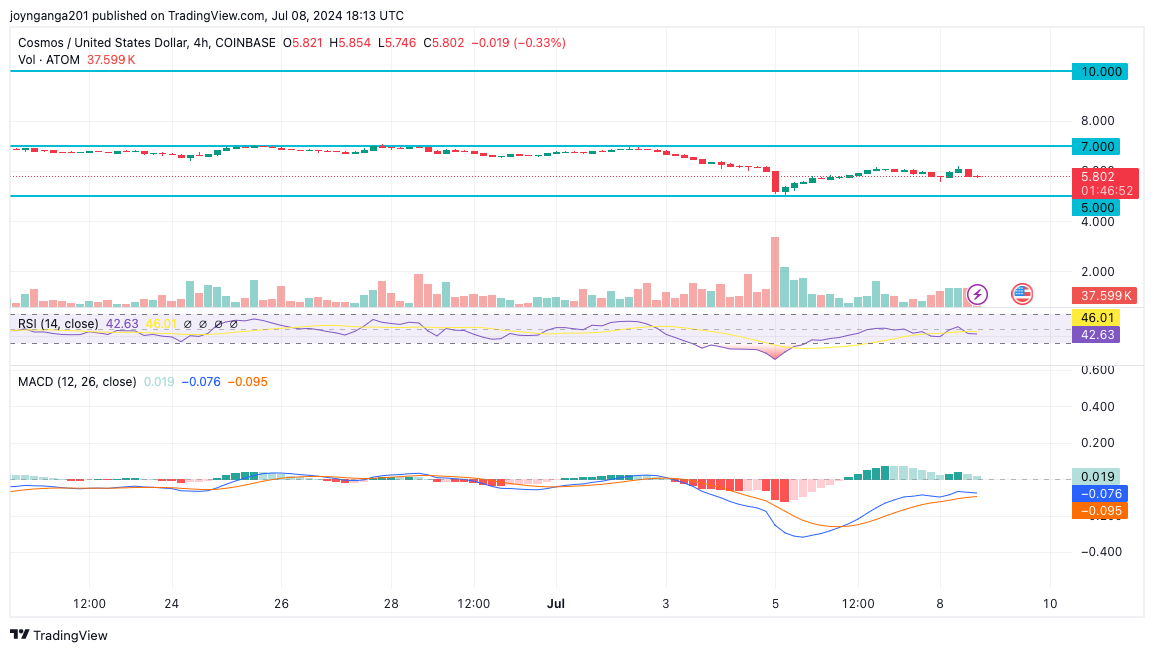
The Moving Average Convergence Divergence (MACD) indicator shows a slight bullish signal. The MACD line is above the signal line, though both are still in negative territory, suggesting weak bullish momentum. The histogram supports this with a minor positive reading, indicating that the recent price trend might reverse to the upside.
Learn More
- Next Cryptocurrency to Explode in July 2024
- Crypto Price Predictions
- Best Solana Meme Coins to Buy In 2024
- Just In: VanEck files S-1 for Spot Ethereum ETF


Advertisement


