

Bitcoin’s (BTC) price surged after a long weekend, breaking above $60,000 resistance. The leading cryptocurrency increased by 4% in the last 24 hours to trade at $62,876 on Monday.
Immense volume supports the breakout, up almost 22% on the day to $26.55 billion. This sudden interest in Bitcoin also positively impacts its market capitalization, which, according to CoinMarketCap, is up 4% to $1.24 trillion. BTC ranks #1 among other cryptocurrencies. The sudden price increase is likely due to several factors, including the better-than-expected CPI report, the assassination attempt on Trump, and the end of the German government’s recent Bitcoin sale.
Advertisement

Meanwhile, big institutional investors in the U.S. have started accumulating the king of cryptos(BTC). According to on-chain analytics firm CryptoQuant, the presumption was made after observing the Coinbase Premium Gap, which is seen as a measure of whale accumulation in the U.S.
U.S whales, institutional #Bitcoin purchases increase again
“Looking at the Coinbase premium gap, the movement of U.S whales, which had a selling trend, has recently become buy.” – By @DanCoinInvestor
Read more 👇https://t.co/ns7Oo4y1nE pic.twitter.com/Vxjxsat8r4
— CryptoQuant.com (@cryptoquant_com) July 15, 2024
Bitcoin Statistical Data
Based on Coinmarketcap data:
- BTC price now – $62,876
- BTC market cap – $1.24 trillion
- BTC total supply – 19.73 million
- BTC circulating supply – 19.73 million
- BTC ranking – #1
The Bitcoin price is trading bullishly after breaking above the $60,000 resistance. Bitcoin had not traded at this level since July 3, when it faced resistance around the $58,000 mark. A bullish wave traversed the crypto market, leading to price upswings, with Bitcoin jumping above $60,000 and Ethereum running up to $3,349. While profit booking unhampered the continuation of the uptrend for most cryptos, Bitcoin continues to rage on.
Meanwhile, using the 50-day Simple Moving Average (SMA)(blue) as support at $60,213, bulls propelled BTC above the subsequent resistance at $60,000 to $62,680.
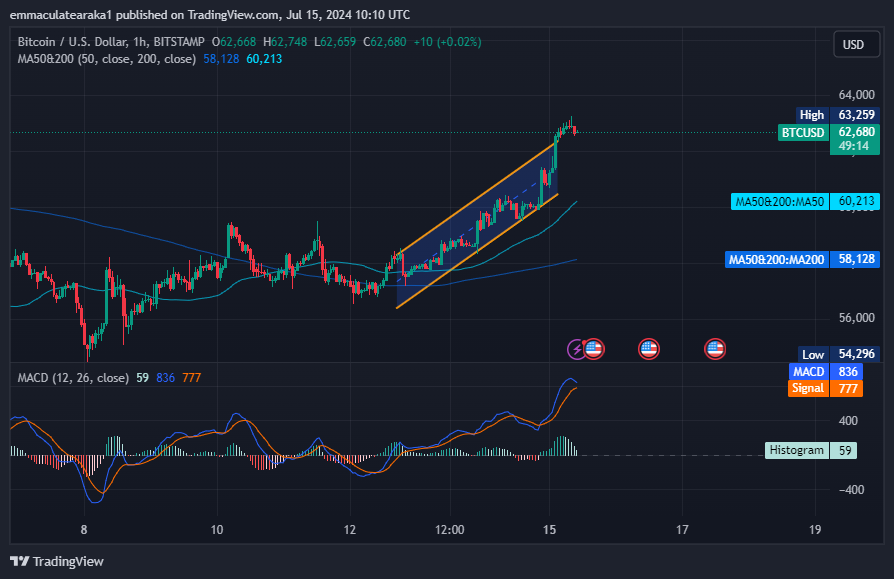
The path with the least resistance is bound to stick to the upside based on the position of the Moving Average Convergence Divergence (MACD) indicator above the neutral 0.000 area. With the MACD in (blue) above the (orange) signal line, traders can have confidence in the current uptrend.
In the meantime, upholding the short-term support at the 200-day Simple Moving Average (SMA) would be in the best interest of the bulls and traders willing to bet on the impending move to $70,000.
On the other hand, the Relative Strength Index (RSI) has its strength at 71, tilting the odds towards the buyers. However, the RSI on the one-hour chart cautions traders to anticipate a reversal following overbought conditions. However, this reversal might be brief enough to allow more investors to buy BTC, thus building momentum for a breakout above $70,000.
Can Bitcoin Bulls Rally Above $70,000 Mark?
As per Bitcoin’s price analysis on the 1-hour chart, the bulls are pushing the token towards sustained bullish momentum, having surpassed the upper boundary of the rising channel pattern. In this scenario, the bulls have the upper hand, targeting the $70,000 resistance mark.
However, the token’s overbought state suggests it is currently overvalued, which may prompt a slight retrace in the coming days. In such a scenario, $60,213, coinciding with the 50-day SMA, offers firm support. In a dire case, the BTC price might plunge to around $58,128, which coincides with the 200-SMA, acting as a cushion against downward pressure.
Read More
- Next Cryptocurrency to Explode in July 2024
- Crypto Price Predictions
- Best Solana Meme Coins to Buy In 2024
- ETH Surges Above $3300 as Analyst Tip Ethereum ETF Approvals This Week

Advertisement


