


Bitcoin price has soared 9%, with the BTC/USD trading at 55,216. Despite the recent surge, its trading volume is down 38% to $60 billion, suggesting a fall in market activity among traders. Often, a mismatch in trading volume and the price shows a lack of confidence among the BTC bulls.
With the recent price movement, veteran trader Peter Brandt has taken to the X platform, mentioning the Price history of Bitcoin Halving Cycles. He has noted that the current post-halving correction is similar to the 2015-2017.
Advertisement

Price history of Bitcoin Halving Cycles $BTC
Key points:
1. Current post halving correction is similar to 2015-2017
2. Post halving corrections in past two cycles indicate that a new bull cycle high could be many weeks from now pic.twitter.com/2dMvoJcrNx— Peter Brandt (@PeterLBrandt) August 6, 2024
He has notably added, “Post halving corrections in past two cycles indicate that a new bull cycle high could be many weeks from now.” However, it is only time to see whether history will repeat itself or a new wave could unfold.
Bitcoin Statistical Data
Based on CoinmarketCap data:
- BTC price now – $55,216
- BTC market cap – $1.09 trillion
- BTC total supply – 19 million
- BTC circulating supply – 19 million
- BTC ranking – #1
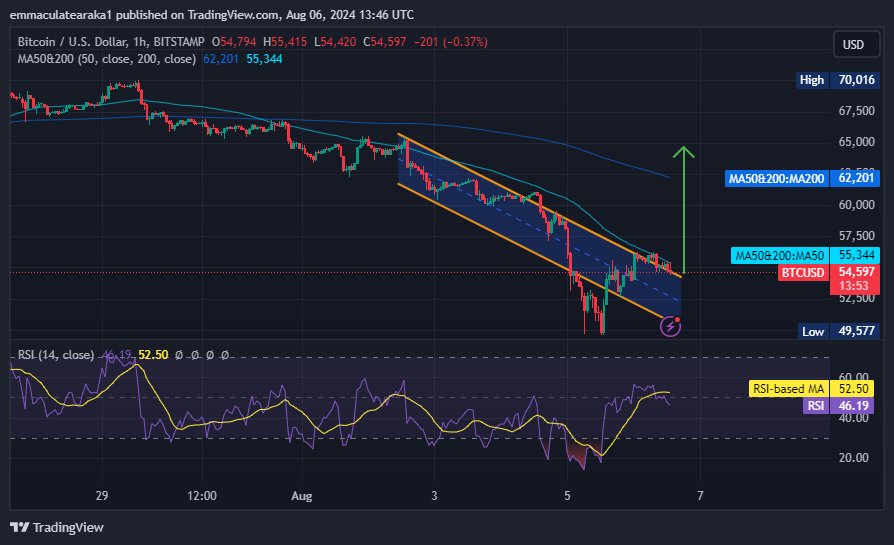
The Bitcoin price is trading with a bearish bias, holding steady above the upper trendline of the falling channel. After the moving averages formed a death cross at around $66,904, the Bitcoin price continued to decline in August. Yesterday, Bitcoin’s price dropped below the falling channel to as low as $49,577. However, the price seems to be rebounding from below the channel’s lower boundary, now trading within its upper boundary.
The BTC price still trades below the 50-day and 200-day Simple Moving Averages, tilting the odds toward the seller. However, with the recent market recovery, increased buying pressure will see the bulls counter the $55,344 and $62,201 resistance barriers.
A flip of the $55,344 resistance level into a support floor would pave the way for further upside. A break and close above it would encourage more buy orders, potentially sending the pioneer cryptocurrency to its ATH at $70,016. The gains could extrapolate towards a new peak in a highly bullish case.
The Relative Strength Index (RSI) outlook, which has rebounded from the 30-oversold zone, shows that the bulls are not stopping anytime soon. Currently, the RSI sits at 46, in which increased buying pressure will set the indicator above the 50-mean threshold. In such a case, the sellers will be exhausted, tilting the odds in favor of the buyers.
Buy signals from the Moving Average Convergence Divergence (MACD) backs the bullish outlook in the market. The momentum indicator has even flipped above the signal line, thus adding credence to the bullish narrative.
Bitcoin Price Future Outlook
The 4-hour chart analysis shows a tug-of-war among the bulls and bears, but the odds tilt towards the bulls. With the momentum indicator (MACD) suggesting a buy signal, the BTC price may surge as traders and investors are inclined to buy more BTC. If the bulls show resilience at this level, the Bitcoin price could surge, surpassing the resistance levels. If the buyers flip the 50-day SMA into support, the BTC could test the following resistance key at $62,136.
Conversely, if the bears step in and the entire market turns negative, the BTC price could drop. The Bitcoin price could extend the fall if the $54,713 support level breaks. In a dire case, the $52,548 support would act as a cushion against downward pressure.
Learn More

Advertisement


