Will Ethereum Price Hit $4000 in 2024?

Cryptocurrency trading is speculative and your capital is at risk when you trade. We may earn affiliate commissions from some of the products on this page - at no extra cost to you.

Highlights:
- Ethereum price has seen a slight dip over the past 24-hours
- ETH price is hovering around $3,300, signaling strong market momentum.
- If Bullish mounts more pressure, the ETH could Hit $4,000 soon.
Ethereum price has surged, crossing key support levels as the crypto market shows renewed momentum. The second-largest cryptocurrency by market cap demonstrates robust growth, driven by increasing investor interest and favorable market dynamics.
Advertisement

ETH has broken long technical barriers due to positive technical signals and a bullish outlook. Minor market corrections have occurred, but the path for Ethereum is upward towards new price points. This performance showcases the digital asset’s resiliency and today’s strong standing in the evolving cryptoverse, with the present crypto landscape eying $4000.
The Ethereum price has experienced significant growth recently, climbing by 35% over the past month. The cryptocurrency has also posted a 5% gain in the last seven days, reflecting growing investor confidence and heightened market activity. As of today, Ethereum trades at approximately $3,333 despite a slight dip in the last 24 hours.
The wider cryptocurrency market overall is caught in a trading range, with a few of the largest tokens failing to mount any significant upward or downward momentum. Nevertheless, Bitcoin has shot past $65,000, breaking the trend, as crypto sympathizers look up.
Ethereum Breakout Mirrors Bitcoin’s 2020 Rally
The crypto expert shared an X post, formerly known as Twitter, to highlight Ethereum’s remarkable price trendline over the past few years. The expert drew a parallel to the high point that Bitcoin has since achieved, and Ethereum’s trajectory from 2018 to 2020 might be following the same path soon.
$ETH has formed a massive trendline over the past years – just like #Bitcoin did in 2018-2020.
When BTC finally broke out, it rallied for months on end.
Could see ETH pull a similar stunt soon 👀🚀 pic.twitter.com/KCYQpLeE3H
— Jelle (@CryptoJelleNL) November 26, 2024
The post was comprised of a visual analysis of current Ethereum price action in comparison to Bitcoin’s historical chart. As an illustration, the analysis showed how Bitcoin has gone through a prolonged consolidation phase before a big breakout in 2020. The rally Bitcoin experienced in this period did well, maintaining months of upward momentum to reach new all-time highs.
The price action takes a very consistent trendline with the potential for a similar breakout. If Ethereum breaks through this resistance, analysts say it should lead to an extended bullish rally akin to Bitcoin’s past performance.
How High Can ETH Price Go This Year?
Ethereum price is currently facing a significant resistance level at $3,400, with a potential climb to $3,600 if the barrier is surpassed. Analysts suggest breaking this resistance could set the stage for Ethereum to approach $4,000 by late 2024, signaling a bullish outlook.
Conversely, failure to maintain upward momentum may push prices back to the $3,300 support zone. A bearish market sentiment could intensify, dragging Ethereum further down to $3,000. If negative trends persist, the cryptocurrency might test the $2,500 level, reflecting increased skepticism in the market. Ethereum’s trajectory hinges on breaking resistance or maintaining key support levels.
The latest data from IntoTheBlock reveals Ethereum’s on-chain performance, emphasizing its holder distribution and profitability metrics. Approximately 89.28% of Ethereum holders are “In the Money,” representing 123.69 million ETH, valued at $410.62 billion.
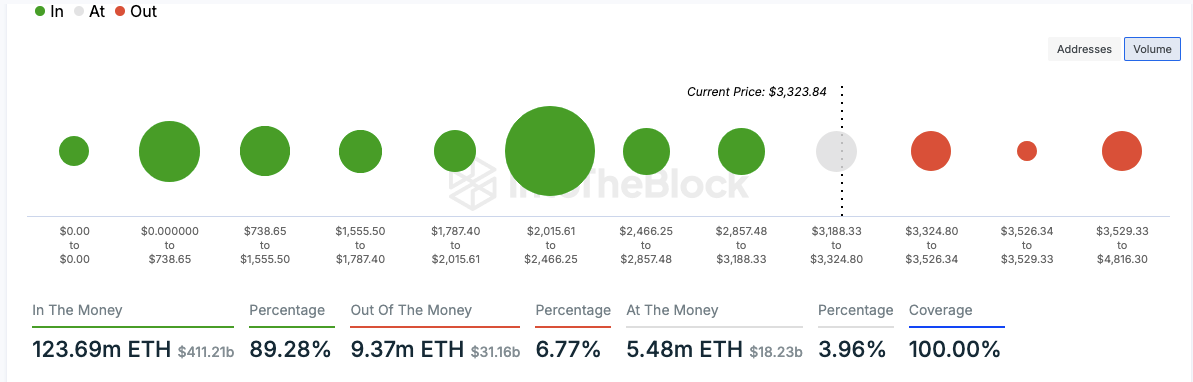
Conversely, only 9.37 million ETH, or 6.77%, remains “Out of the Money,” with a cumulative value of $31.12 billion. An additional 5.48 million ETH, worth $18.2 billion, is “At the Money,” showcasing Ethereum’s robust market positioning.
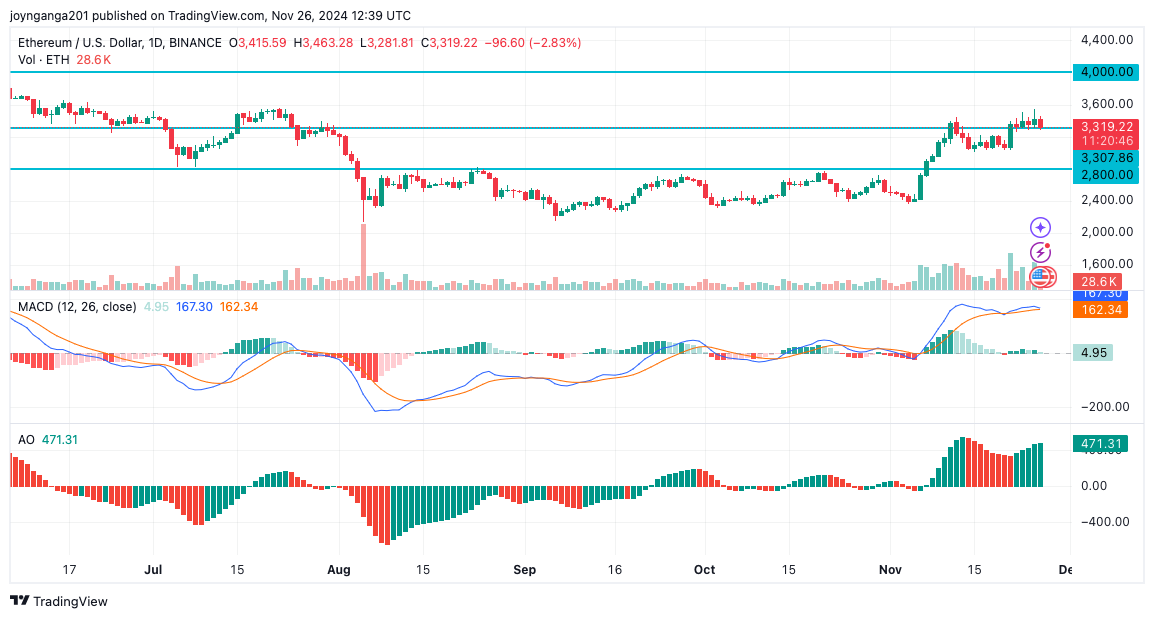
The 24-hour technical indicators for the Ethereum price show a light market consolidation. The Moving Average Convergence Divergence (MACD) indicator highlights weakening bullish momentum. The MACD line remains above the signal line, but the gap narrows, signaling potential bearish pressure. The Awesome Oscillator (AO) reflects a gradual reduction in upward momentum, with green bars diminishing in size, suggesting a possible trend reversal.
Advertisement


