Toncoin Price plunges 2.5% on a 445% Yearly Surge: Is $10 Within Reach?

Cryptocurrency trading is speculative and your capital is at risk when you trade. We may earn affiliate commissions from some of the products on this page - at no extra cost to you.

Over the last 24 hours, the price of Toncoin has dropped by 2.5% to trade at $7.8. The trading volume also decreased by 19.7% to $253 million during the same time frame. With a market cap of $18 billion, Toncoin has surged 445% this year alone, securing a spot among the top 10 cryptocurrencies by market cap.
This impressive performance has sparked investor interest in Toncoin’s potential to reach $10 this year. TON is the native token of the Open Network, a proof-of-stake blockchain. The Open Network has seen a surge in demand thanks to the popularity of several TON-based games, including Tapswap, Pixelverse, and Notcoin.
Advertisement

TapSwap is the biggest rival to Notcoin, which recently launched and reached a market cap of over $1.8 billion. According to app data, Notcoin now has over 53 million users. TapSwap has seen its daily user count soar to over 17.9 million, making it the most active social platform in the industry. The rise in large transactions suggests whales exploit current market conditions to acquire cheap TON. On July 3, large transactions peaked at 962,000 TON.
Toncoin Price Statistics
- Toncoin price: $7.8
- Market cap: $18 billion
- Trading volume: $253 million
- Circulating supply: 2.5 billion
- Total supply: 5.1 million
Toncoin Price Analysis: Bears Continue the Bearish Trend
Toncoin initially saw bullish momentum as prices formed an ascending wedge pattern. However, the bears have since taken control, forcing the price to the lower boundary of the wedge. This pattern indicates that the bearish trend is likely to continue.
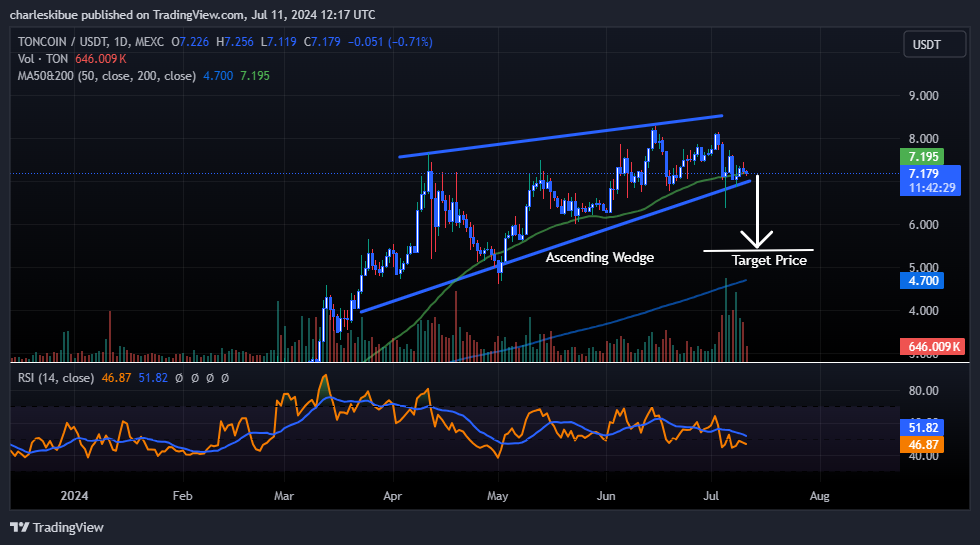
The market currently trades above both the 50-day and 200-day simple moving averages (SMA), suggesting a generally bullish outlook. However, the price is on the verge of crossing below the 50-day SMA, which could indicate a shift towards bearish sentiment. This potential crossover often serves as a warning sign that the market might be moving into a downtrend.
Recently, bears have shown their strength by pushing the price down from the resistance level of $8.14808. This failure to break through resistance highlights the control bears currently have over the market. Despite this, as long as the 200-day SMA rises, it suggests a longer-term bullish trend that could invalidate these shorter-term bearish signals.
Toncoin Price Technicals Indicate Bearish Sentiment
The Relative Strength Index (RSI) further supports the possibility of a bearish trend. It is currently below the 50-midline level and heading towards the 30-oversold level. An RSI below 50 indicates bearish momentum, and if it reaches the 30-oversold level, it signals that the market might be oversold. This condition often presents a buying opportunity for bulls, as the price could rebound from oversold conditions.
The Moving Average Convergence Divergence (MACD) also suggests an upcoming bearish trend. The orange signal line flows above the blue MACD line, indicating bearish momentum. Large red histogram bars further support bears’ potential to maintain market control.
The bears also demonstrated significant strength by driving the price down after regrouping at the $8.14808 resistance level. They aim to continue pushing the market lower, targeting a price of $6.21958. On the other hand, if the bulls manage to maintain their momentum, they could push the price up to $8.40059.
Learn More
- Next Cryptocurrency to Explode in July 2024
- Crypto Price Predictions
- Best Solana Meme Coins to Buy In 2024
- Binance Delists BTC and USDT Margin Pairs with TUSD

Advertisement


