Supra Price Soars 65% Following Launch of Custom Index Price Feeds – Is a $0.05 Target Within Reach?

Cryptocurrency trading is speculative and your capital is at risk when you trade. We may earn affiliate commissions from some of the products on this page - at no extra cost to you.

Highlights:
- Supra price surged to $0.01744 with a 275% spike in trading volume to $60 million in 24 hours.
- Supra Layer 1 introduces customizable, on-chain asset baskets for users.
- The new index feature enables diverse investment options with seamless dApp integration.
The Supra price has skyrocketed 65% in the last 24 hours to trade at $0.01744 as of 4:30 a.m. EST on a 275% pump in trading volume to $60 million. This price surge comes after Supra Layer 1 unveiled its innovative Custom Index price feeds, a game-changing feature allowing users to create fully on-chain, tradeable asset baskets.
Advertisement

These indices enable investors to combine various asset classes—cryptocurrencies, stocks, real-world assets, commodities, and more—into a single, customizable basket. Users can define asset selection, weight allocations, and rebalancing schedules just like in ETFs tracking the S&P 500 or FTSE 100, creating a unified price feed to track the performance of the basket.
BREAKING: You can now create and deploy Custom Index price feeds on Supra Layer 1 ⚡️
Your own custom indices, fully onchain, fast af. Crypto, stocks, real world assets, commodities — or any combination of assets you can think of. If you can think of it, you can turn it into a… pic.twitter.com/kgtIgPBb3U
— Supra (@SUPRA_Labs) December 3, 2024
What sets Supra apart is its permissionless, transparent, and user-first approach. Everyone can create and manage an index, which will make asset diversification much easier. The options are endless: Top 10 Layer 1 meme coins, EVM tokens, AI-driven assets, or real-world assets. The new possibilities for investors and developers are endless.
These are not just static investment tools; they integrate seamlessly with decentralized applications, such as DEXs, perpetual protocols, gaming platforms, and many more. Powered by native Supra Oracle price feeds and advanced smart contracts, the system provides fast, secure, and highly reliable functionality.
SUPRA Statistics
- Supra Price: $0.01744
- Market Capitalization: $1.7 billion
- Trading Volume: $60 million
- Circulating Supply: 100 billion
- Total Supply: 100 billion
Supra Price Spikes in a Parabolic Curve
The SUPRA/USDT pair on the illustrates a strong bullish rally characterized by a parabolic price movement. The price surged from a key support level at $0.010886, where consolidation occurred, to a recent high of $0.022007. This move represents over a 100% increase, underscoring significant buyer interest.
A pivotal breakout above $0.012580 marked the transition from a sideways trend to an aggressive upward trajectory. The parabolic curve visible on the chart would suggest accelerating buying momentum, typical of strong bullish phases. However, this pattern is often followed by volatility, so caution is warranted.
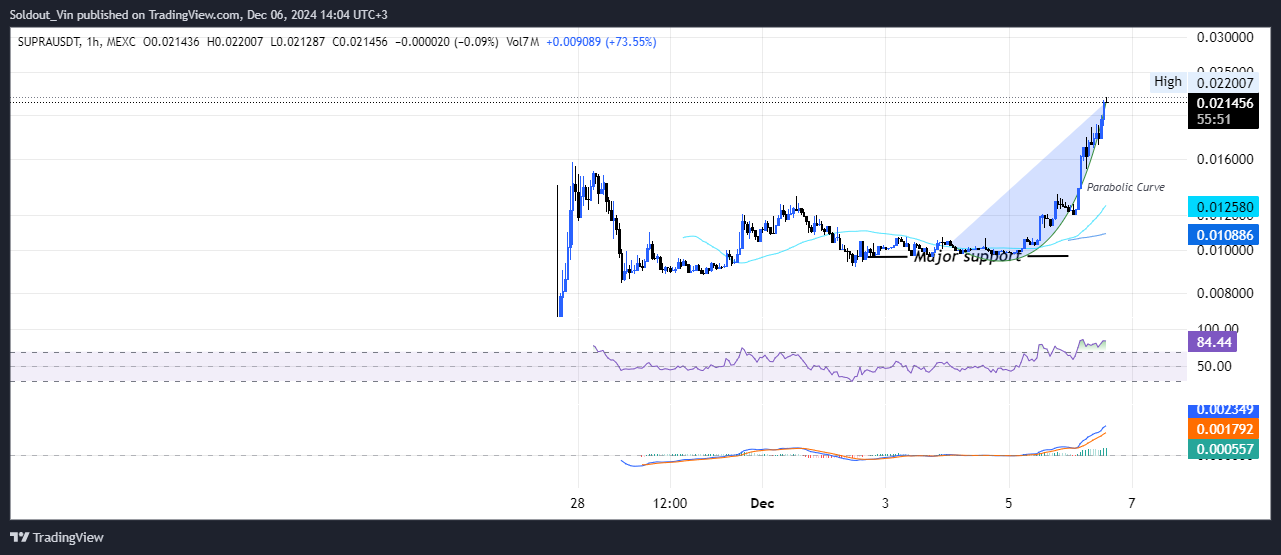
Key indicators support this analysis. The RSI (Relative Strength Index) is at 84.44, well into the overbought zone, signaling potential exhaustion in the short term. Although so, the MACD keeps its bullish prospects, and the divergence between the MACD and signal lines, showing greater gaps, tends to maintain upward pressure on the stock.
Trading Volume Surge Signals Strong Rally
The abrupt rise in trading volume at the parabolic stage confirms this rally’s intensity, showing active market participation. The moving averages support this further: the average of a shorter term sloped upward and acts like dynamic support.
Moving forward, the crucial level to consider is $0.022. A break above this level could trigger a further surge in buying interest. After this resistance is broken, the price could reach higher levels near $0.05 or higher.
On the other hand, a loss of momentum in the rally may push the price to previous support levels at $0.016 or $0.012580. These levels must be carefully monitored because a break below them can indicate a deeper correction.
![]()
eToro Platform
Best Crypto Exchange
- Over 90 top cryptos to trade
- Regulated by top-tier entities
- User-friendly trading app
- 30+ million users
![]()
eToro is a multi-asset investment platform. The value of your investments may go up or down. Your capital is at risk. Don’t invest unless you’re prepared to lose all the money you invest. This is a high-risk investment and you should not expect to be protected if something goes wrong.
Advertisement


