Supra Price Drops Despite Decentralized Design Sparking Investor Optimism – Can SUPRA Rebound to $0.1?

Cryptocurrency trading is speculative and your capital is at risk when you trade. We may earn affiliate commissions from some of the products on this page - at no extra cost to you.

Highlights:
- Supra price drops 7% to $0.04088 with a 75% drop in trading volume.
- Surge of 137% after Bybit listing, now stabilizing near the $0.0105–$0.040 demand zone.
- The decentralized, user-first design supports DEXs, gaming, and smart contracts.
The Supra price has slumped 7% in the last 24 hours to trade at $0.04088 as of 4:30 a.m. EST on a 75% drop in trading volume to $139 million. SUPRA burst into Bybit and surged 137% within six hours as the latest Layer-1 blockchain. Since then, the crypto has stabilized above the demand zone of $0.0105–$0.040 and was trading in comfort near the 50% Fibonacci retracement of its surge.
Advertisement

What’s really exciting with SUPRA is its permissionless and user-first design: think about the possibility of easily creating and managing your whether it’s the top Layer 1 meme coins, EVM tokens, AI-based assets, or even real-world ones. This opens a world of possibilities for both investors and developers.
But it doesn’t stop there: these are not simple investment tools; they work decentralized with DEXs, gaming platforms, and perpetual protocols. The Supra Oracle price feeds and complex smart contracts power the system to ensure speed, security, and reliability and make everything work seamlessly.
SUPRA Statistics
- Supra Price: $0.04088
- Market Capitalization: $4.1 billion
- Trading Volume: $139 million
- Circulating Supply: 100 billion
- Total Supply: 100 billion
Supra Price Signals a Bull Rally Above the Wedge
This 1-hour chart of the SUPRAUSDT from the MEXC exchange describes a critical phase where its price consolidates within a wedge pattern, usually indicative of the development of an upside breakout. The price is currently trading at $0.040880 as the wedge structure tightens with each passing moment, indicating that a potential price move is close to happening.
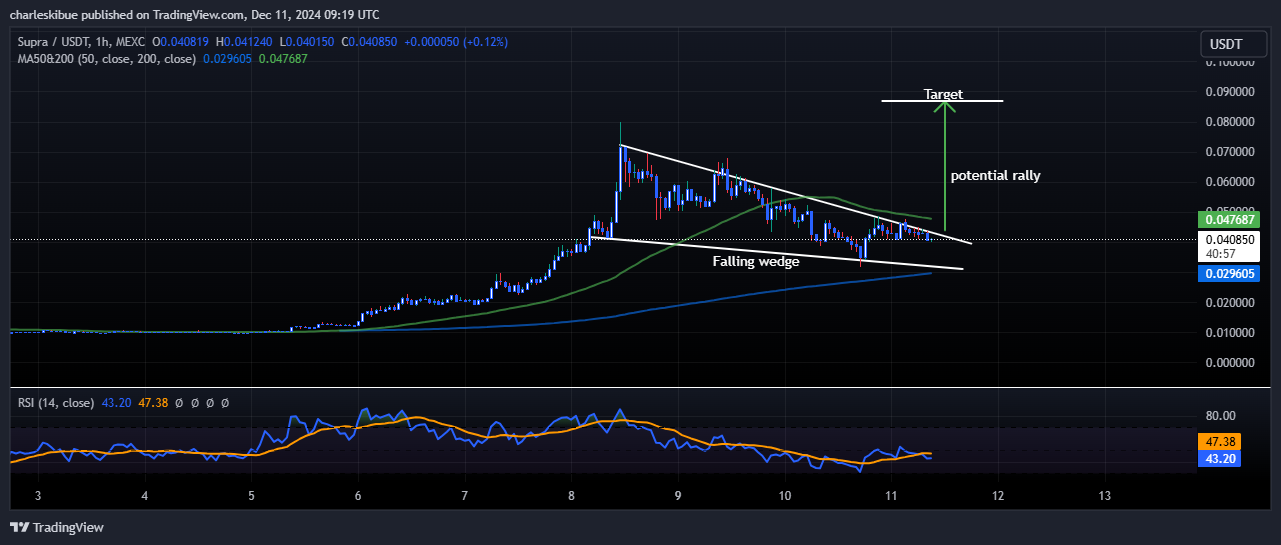
The 50 EMA stands at $0.047688 and acts as immediate overhead resistance, whereas the 200 SMA is at $0.029605 and forms strong dynamic support. Every investor should watch these moving average levels, as they always tend to give the direction for the next trend.
RSI Signals Bullish Breakout Potential
RSI is at 43.27, below the neutral area, and has much room to advance upwards before reaching overbought conditions. This also agrees with the bullish nature of the falling wedge, which usually sees the price break out to the upside. Confirmation of a breakout would come with a decisive move above $0.041, supported by a rise in trading volume.
A breakout might trigger a rally toward the $0.047688-$0.050 range, where the 50 SMA acts as resistance. Beyond this, continuous buying pressure may unlock the door toward higher levels, consolidating the bulls’ conviction.
Failure to break out, on the other hand, if the price fell below the lower boundary of the wedge at approximately $0.038, would indicate weakness and begin a bearish continuation. In this scenario, the price might retrace toward the 200 SMA at $0.029605, which is critical support. This should definitely subdue the bullish sentiment and turn market sentiment.
To trade this setup, one must closely watch volume trends, candlestick patterns, and RSI levels, as these will confirm a breakout or breakdown.
![]()
eToro Platform
Best Crypto Exchange
- Over 90 top cryptos to trade
- Regulated by top-tier entities
- User-friendly trading app
- 30+ million users
![]()
eToro is a multi-asset investment platform. The value of your investments may go up or down. Your capital is at risk. Don’t invest unless you’re prepared to lose all the money you invest. This is a high-risk investment and you should not expect to be protected if something goes wrong.
Advertisement


