Sui Price Surges 7% as Analyst Bullish Setup Predicts a Bullish Rally Ahead

Cryptocurrency trading is speculative and your capital is at risk when you trade. We may earn affiliate commissions from some of the products on this page - at no extra cost to you.

Highlights:
- Sui price rose 7% to $2.02 with $1 billion in trading volume and a $5.5 billion market cap.
- Analyst Satoshi Flipper targets $2.80, noting support bounce, depending on Bitcoin.
- SUI/USD rebounded from $1.90 support, aiming for $2.20, with a bullish MACD and rising RSI.
The Sui price has surged 7% in the last 24 hours to trade at $2.02 as of 8 a.m. EST, on a 41% jump in trading volume to $1 billion. Now, the market capitalization stands at $5.5 billion.
Advertisement

According to Satoshi Flipper, an analyst on X (formerly Twitter), a long position has been opened for the Sui price based on a broadening wedge pattern. The price recently bounced off the pattern’s lower support, indicating that support has held, which could lead to an upward move toward the target of $2.80 at the upper resistance line.
$SUI/usdt 4 hour
Finally opened a long for $SUI this am, I really like this setup, price nicely bouncing off broadening wedge support … top of the range is inevitable w/ some cooperation from $BTC
LFG 🚀🚀 pic.twitter.com/Bx981wAhzR
— Satoshi Flipper (@SatoshiFlipper) October 24, 2024
However, the analyst cautions that reaching this target depends on broader market conditions, especially Bitcoin’s price movement, highlighting the correlation between $SUI and the overall crypto market.
SUI Statistics
- Sui price: $2.02
- market Capitalization:$5.5 billion
- Trading volume: $1 billion
- Circulation Supply: 2.7 billion
- Total Supply: 10 billion
SUI Price Rebounds Within a Bearish Channel
Key technical signals of the SUI/USD in a 2-hour timeframe represent a bearish channel with parallel trendlines sloping downwards. This pattern would, therefore, indicate a recent price decline for some time, within which it had reversed from the lower limit of this channel, which now serves as support at approximately $1.90. It could mean an attempt to reverse the downtrend.
The risk-reward setup and the risk zone lie just beneath the recent support at $1.90. The marked reward area targets a possible upward move toward the $2.20 region, which indicates a very favorable risk-to-reward ratio for a probable long trade. That means traders expect the price to head to that target and make an appreciable gain compared to what was risked.
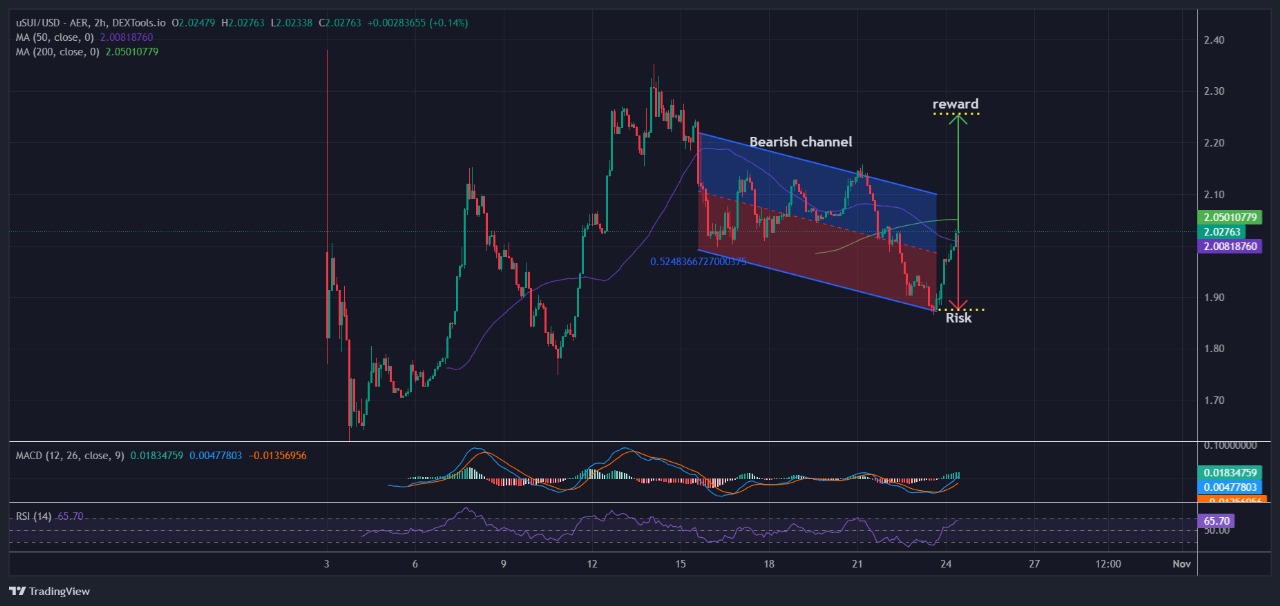
Besides that, the 50% Fibonacci retracement level falls in line with the recent bounce. This level often marks a critical area for any price reversal or consolidation before the resumption of its trend. The fact that this zone has fallen in line with the Fibonacci level strengthens the importance of this zone.
While the 50-period MA lies at around $2.008, the 200-period MA is at approximately $2.05. It seems that the price is testing those averages, and a successful cross above would further signal a bullish reversal or trend continuation in the short to medium term.
Bullish Technicals Fuel the Momentum
The MACD is showing a Sui price possible bullish crossover, as the MACD line goes up through the signal line and the histogram turns green. This is a good omen for building upward momentum. Yet, this should then be ratified with both price action and volumes.
The RSI has ascended to 65.7, indicating that bullish pressure is strengthening but approaching overbought levels. A minimum value of 70 is normally used where traders could look for signs of a possible price correction.
The chart essentially reflects a possible breakout from the bearish channel, with the price rebounding off support at 1.90 and targeting a reward zone around $2.20. The MACD bullish crossover and RSI nearing overbought levels do indicate an increase in buying momentum. However, one must remain cautious around the moving averages and critical price levels in order for any sort of trend reversal to be validated.
Advertisement


