SUI Price Surges 6% in a Week as Its Network is Scheduled to Unlock 83.88M SUI Tokens


The SUI price has plunged 1.58% at press time, with the SUI/USD exchanging hands at $1.84. Its 24-hour trading volume has skyrocketed by 79% to $1.54 billion, indicating growing market interest. However, SUI has exited the red zone, as it has increased by 6% in a week, 139% in a month, and 275% in a year.
SUI Network is scheduled to unlock 83.88 million SUI tokens, representing 0.84% of the total supply. At current market prices, this unlock amounts to $157.2 million, which constitutes 3.03% of the current market capitalization, according to CryptoRank-io.
Advertisement

📅Upcoming SUI Token Unlock – October 3rd
Based on data from @CryptoRank_io , @SuiNetwork is scheduled to unlock 83.88 million SUI tokens, representing 0.84% of the total supply. At current market prices, this unlock amounts to $157.2 million, which constitutes 3.03% of the… pic.twitter.com/cueW1voE7P
— Maragkos Petros (MDX) (@Oxydo11) October 2, 2024
With SUI’s improved liquidity facilitating cross-chain transactions and growing interest among developers, the only question remains: How High Can SUI Go?
SUI Statistical Data
Based on CoinmarketCap data:
- SUI price now – $1.84
- Trading volume (24h) – $1.54 billion
- Market cap – $5.07 billion
- Total supply – 10 billion
- Circulating supply – 2.76 billion
- SUI ranking – #20
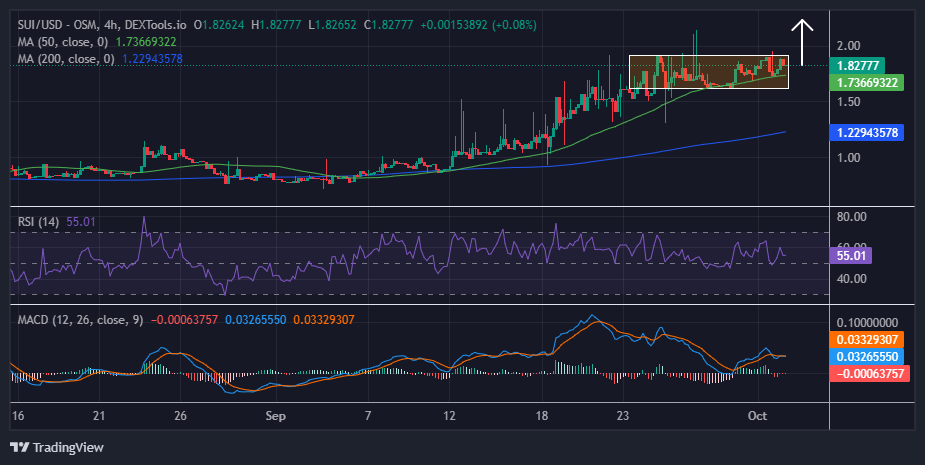
SUI price Aims for a Breakout Above a Rectangle Pattern
The SUI price has gained a spot among the top 20 cryptocurrencies after flipping LTC and making its way into the top 20. Despite the market bleeding, its 24-hour volume has increased massively on the network, meaning there’s a flow of liquidity.
The SUI price is aiming for a breakout above the rectangle pattern in the 4-hour chart. Currently, there is a fierce tug-of-war between the bulls and the bears; however, the odds seem to lean to the upside. The SUI price has been stuck in a tight range, with the upper limit/resistance at $1.91 and the lower limit/support at $1.62. However, this may act as an accumulation period before the bulls initiate a strong move upward.
Based on the 4-hour timeframe chart, the SUI price sits on top of key support areas, reinforced by the 50-day Simple Moving Average (SMA) (green) at $1.73 and the 200-day SMA at $1.22. This outlook upholds a bullish picture in the market.
SUI Price Prediction
The Relative Strength Index (RSI) upholds the growing presence of bulls in the market as it climbs from near oversold conditions, currently at 55.01. It is possible that some traders, especially those who bought SUI at $0.85, may prefer to book profits as bulls struggle with the channel’s upper boundary resistance. However, the likelihood of a breakout to $2, backed by the bullish technical indicators, could keep most traders interested in this token.
On the other hand, a sell signal from the Moving Average Convergence Divergence (MACD) introduces a bearish outlook. However, the blue MACD line seems hurtling towards crossing above the orange signal line. In the meantime, traders will likely keep their buy orders open if the blue MACD line crosses above the orange signal line. The momentum indicator must move upward to the mean line (0.00) and into the positive region to validate the uptrend.
The SUI price will likely increase in the short term, as it will break above the rectangle pattern. Based on the technical information, market sentiment suggests that many investors may hold off on taking profits, aiming for a potential new all-time high (ATH). This could increase the price to around $2.82 or above $3 in the short term.
Conversely, the rally may lose steam if selling pressure increases before the bulls break above the $1.92 resistance. However, key support at $1.73 (coinciding with the 50-day SMA) remains vital. Moreover, a breach below this level could shift sentiment and push SUI to $1.45, postponing anticipated gains.
Advertisement


Emmaculate Araka
Emmaculate Araka is a cryptocurrency writer with published works on Crypto2Community and other news sources. She is believer in the transformative power of crypto and the blockchain industry, conducting on-chain analysis, breaking down market-triggering events, and helping traders and investors benefit from expert technical price analysis. Emmaculate finds gratification in diving deep into the crypto space, earning herself significant knowledge and experience. She holds a Bsc. in Information Science, and outside work, Emmaculate loves reading novels and watching documentaries.
View full profile ›ℹ️About Crypto2Community's Editorial Process
Crypto2Community's editorial policy is centered on delivering thoroughly researched, accurate, and unbiased content. We uphold strict editorial policy and sourcing standards, and each page undergoes diligent review by our team of top crypto industry experts and seasoned editors. This process ensures the integrity, relevance, and value of our content for our readers.