Sui Price Plunges 5%, As SUI Emerges Among Top Tokens By Weekly Price Bounce

Cryptocurrency trading is speculative and your capital is at risk when you trade. We may earn affiliate commissions from some of the products on this page - at no extra cost to you.

The Sui Price has dived 5% to trade at $0.8449 as of 11:23UTC. Accompanying the price movement, SUI’s market capitalization has notably plunged 8% to $2 billion, despite a surge in trading volume by 81% to $182 million, signalling a recent rise in market activity.
Sui token has demonstrated resilience amid market volatility, rebounding from $0.76 to its current price of $0.84 over the past week, placing it among the top tokens with a price bounce back.
Advertisement

TOP TOKENS BY WEEKLY PRICE BOUNCE$FET $AGIX $NEAR $FTM $LDO $PENDLE $AR $SUI $THETA $XTZ pic.twitter.com/5twEYiWpgH
— Cryptogics (@cryptogics) June 24, 2024
Moreover, analysts remain optimistic about the Sui token’s prospects despite external market conditions.
#SUI is on a downward trend, currently trading closer to the lower end of its price range at $0.8675🔻 An 8% drop today suggests more bearish momentum ahead. Watch for a potential bounce near the threshold at $0.87!#SUI #crypto #BTC #Bitcoin #SOL #Solana pic.twitter.com/KerneVfuVW
— CryptoRollerCoaster (@__c__r__c__) June 24, 2024
The token had a strong start this year, reaching new highs of $1.17 before experiencing a significant drop in mid-May. Despite minor rebounds, recent data indicates a bounce back if the bulls muster some strength in the Sui market.
SUI Statistical Data
Based on Coinmarketcap data:
- Sui price now – $0.8449
- Sui market cap – $2.04 billion
- Sui total supply – 10 billion
- Sui circulating supply – 2.4 billion
- Sui ranking – #41
The Sui price is attempting a recovery rally, recording a green candlestick in the four-hour timeframe. However, it remains below the foothold of the falling wedge channel, a bearish technical formation. The formation of a falling wedge pattern suggests the potential for a bullish price reversal. Unless the SUI bulls can haul the Sui price to break above the governing pattern, token holders may see losses.
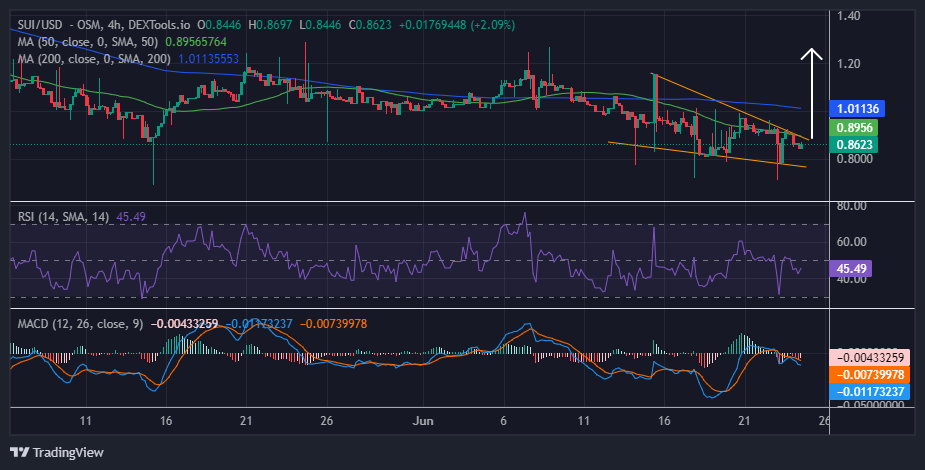
SUI Price Technical Outlook
The technical indicators suggest that the market is currently leaning towards the downside. The Relative Strength Index (RSI) is subdued below the mean level of 50, currently at 45. This indicates that selling pressure is easing, and buyers may prepare to enter the market as the RSI has surged from its oversold region. Should the RSI rebound and surge toward the 70-overbought zone, it would signal intense buying pressure and a possible upward movement for SUI.
Notably, the SUI price is trading below the 50-day and 200-day Simple Moving Averages (SMAs), now acting as the immediate resistance levels at $0.89 and $1.01, respectively. This intensifies the bearish outlook, signalling that the sellers have the upper hand.
Moreover, the Moving Average Convergence Divergence (MACD) is also suppressed below its signal line (orange band). The blue average line has crossed below the orange signal line, a bearish indicator suggesting that negative momentum is valid in SUI’s market price.
Sui Price Prediction: Will the Bulls Trigger A Bullish Reversal In Sui Market Price?
The four-hour chart analysis indicates that SUI is currently on a bearish trend. However, the token hurtles towards breaching the upper boundary of the falling wedge pattern. If the bulls exert some pressure, the SUI price may experience a bullish reversal, driving the price above the upper boundary of the governing pattern.
In such a scenario, the bulls might push the price to around $1.16, surpassing the 50-day and 200-day resistance levels. In a highly bullish case, the bulls might propel the price to a new high of around $1.2500.
Conversely, if the bears exert more pressure at this level, the token may drop further, breaching the lower boundary of the pattern. This would lead to the SUI price retesting at the $0.71 mark.
Read More
- Solana Price Prediction: Is $100 The Next Stop For SOL Amidst Bearish Conditions?
- 12 Best Crypto Exchanges In 2024


Advertisement


