Sui Price plunges 2% as SUI Network Resolves a Bug Delaying Staking Rewards


Highlights:
- SUI price plunges 2% as bearish momentum builds in the market.
- SUI Network resolves a bug delaying staking rewards as distribution resumes epoch 563 without fund loss.
- The SUI price has since experienced an 18.20% pullback from its ATH, currently at $1.93.
The SUI price is down 2.94% today, with the SUI/USD exchanging hands at $1.93. Its trading volume has notably slumped 33% to $478.65 million, showing a fall in market activity. SUI is now down 6.67% in a week, despite a rise of 10% in a month and a whopping 343% in a year.
Advertisement

Meanwhile, the Sui network has resolved a bug that delayed staking rewards, as distribution resumes at epoch 563 without fund loss. The network has disclosed, “No staking rewards or funds have been lost, but the distribution of rewards from epochs 560, 561, and 562 will be delayed until epoch 563.”
PSA: Today’s epoch change at 10:30am PT triggered a bug that prevented the distribution of staking rewards. The root cause has been identified, and a fix is being implemented that will go live at epoch 563. Network operations remain unaffected. No staking rewards or funds have…
— Sui (@SuiNetwork) October 24, 2024
Users are advised to avoid unstaking until epoch 563 commences on Saturday, October 26, at 10:30 am PT. Unstaking before then may forfeit rewards that have otherwise been earned during epochs 560, 561, and 562.
Sui Statistical Data
Based on CoinmarketCap data:
- SUI price now – $1.93
- Trading volume (24h) – $478.65 million
- Market cap – $5.29 billion
- Total supply – 10 billion
- Circulating supply – 2.76 billion
- SUI ranking – #21
Sui price surged by an impressive 10% in September, with momentum extending into October. On October 14, 2024, SUI nearly reached a new all-time high, climbing to $2.36. However, the price has since experienced an 18.20% pullback from this peak, currently at $1.93. This has resulted in a descending parallel channel.
Despite the decline, the overall performance indicates strong market support, and investors remain optimistic about future movements. However, in the 2-hour chart timeframe, the bulls have lost ground, allowing the bears to take control of the market.
Bearish Momentum Builds in the SUI Market
Recently, the bears have flipped the $1.96 and $2.04 moving averages into immediate resistance zones. To be safe, the bulls must conquer the barriers to encourage already-sidelined investors to join the uptrend without worrying about sudden corrections.
The Relative Strength Index has declined to 44.01, suggesting intense selling pressure. Often, a fall below the 50 threshold indicates that the bears are gaining control of the market, which could lead to more downside if the RSI continues to trend lower.
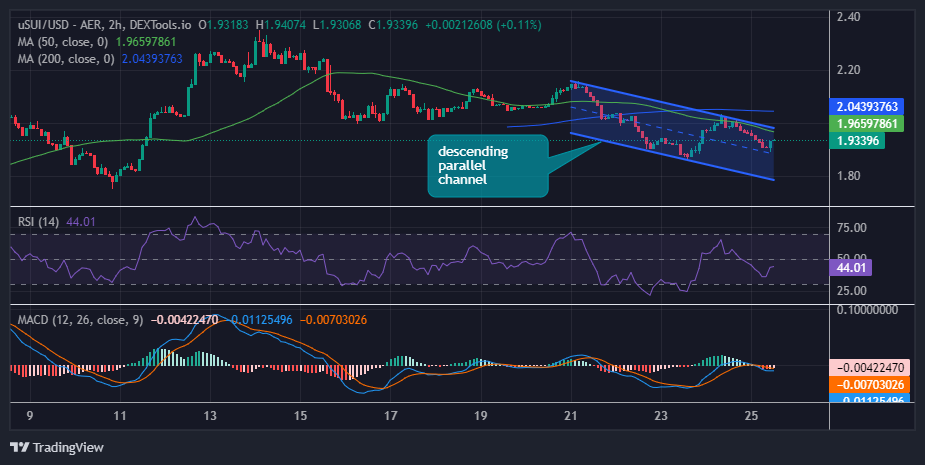
On the other fence, the Moving Average Convergence introduces a bearish outlook. This suggests intense selling pressure as the blue MACD line has crossed below the orange signal line, upholding a sell signal. While traders sought exposure to SUI as the blue MACD line crossed above the orange signal line, they were likely to close positions if the opposite happened. In other words, traders will be inclined to sell unless the blue MACD line flips above the orange signal line.
SUI Price Outlook
Based on the 2-hour chart time frame, the bears have the upper hand, painting the bigger picture bearish. On the downside, if the selling pressure mounts, the bears could reach the $1.87 support level.
On the upside, if the bulls gain momentum and defend the current support level, the $1.96 resistance barrier could be flipped into support. In a highly bullish scenario, the bulls could initiate a rally, breaking above the $2.04 barrier, invalidating the bearish sentiment.
Advertisement


Emmaculate Araka
Emmaculate Araka is a cryptocurrency writer with published works on Crypto2Community and other news sources. She is believer in the transformative power of crypto and the blockchain industry, conducting on-chain analysis, breaking down market-triggering events, and helping traders and investors benefit from expert technical price analysis. Emmaculate finds gratification in diving deep into the crypto space, earning herself significant knowledge and experience. She holds a Bsc. in Information Science, and outside work, Emmaculate loves reading novels and watching documentaries.
View full profile ›ℹ️About Crypto2Community's Editorial Process
Crypto2Community's editorial policy is centered on delivering thoroughly researched, accurate, and unbiased content. We uphold strict editorial policy and sourcing standards, and each page undergoes diligent review by our team of top crypto industry experts and seasoned editors. This process ensures the integrity, relevance, and value of our content for our readers.