SUI Price Hits a New ATH of $3.28 as SUI’s TVL Steadily Rises

Cryptocurrency trading is speculative and your capital is at risk when you trade. We may earn affiliate commissions from some of the products on this page - at no extra cost to you.

Highlights:
- SUI price hits a new all-time high of $3.283, pushing its market cap past $9 billion.
- SUI’s TVL is also steadily increasing, confirming the growing interest in its ecosystem.
- Increased momentum will see SUI bulls target the $3.5 mark or above to $5.
The market is on fire now, as the SUI price sets a new ATH at $3.28. Moreover, market capitalization is breaking records, and it looks like crypto enthusiasm is back on top. SUI rallied 2% today to trade at $3.15 on Nov 11, during the European Trading Sessions. Today, it’s not just Bitcoin in the spotlight—SUI has also hit a new ATH and may keep soaring higher. SUI’s TVL is also steadily increasing, confirming the growing interest in its ecosystem.
Advertisement

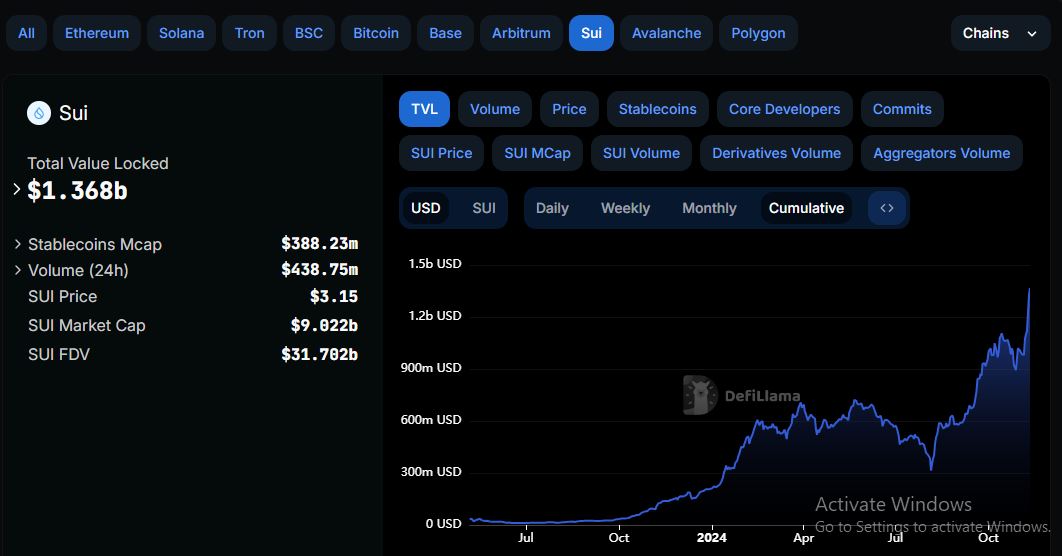
Sui’s Total Value Locked has jumped to $1.368 billion, bolstering investor confidence. Its market cap has notably skyrocketed, almost hitting $10 billion. It is currently at $9.822 billion, a 3.5% increase in the past 24 hours.
Sui Statistical Data
Based on CoinmarketCap data:
- SUI price now – $3.15
- Trading volume (24h) – $3.50 billion
- Market cap – $9.05 billion
- Total supply – 10 billion
- Circulating supply – 2.85 billion
- SUI ranking – #14
SUI Price Breaks Above the Parallel Channel, Setting a New ATH
Bitcoin has reached a new all-time high of $81,801, driven by solid market sentiment and President Trump’s pro-crypto stance. The excitement doesn’t stop with Bitcoin – SUI has set a new ATH at $3.283 before retracing to $3.15 as investor confidence bolsters.
The Sui bulls have cleared the seller congestion in the market, painting the bigger picture bullish. The SUI price trades well above the vital bullish indicators, including 50-day MA and 200-day MA. The bulls have flipped the $1.24 and $2.01 into immediate support levels, enabling them to steady the uptrend.
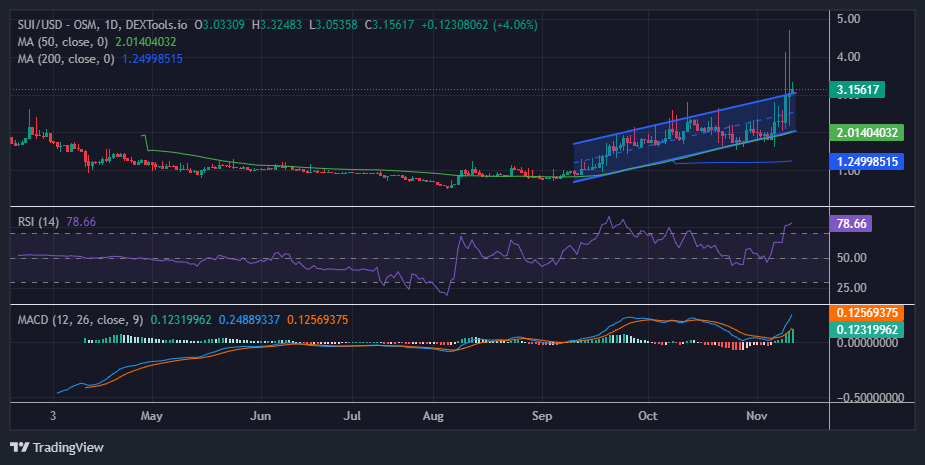
However, the Relative Strength Index (RSI) cautions traders of a potential correction. After climbing from support at the mid-line (50), the RSI jumped into the overbought area, currently sitting at 78.66. Traders won’t have to worry about sudden pullbacks with the RSI above 70, as this position also means a correction is imminent.
Additionally, the Moving Average Convergence Divergence (MACD) indicator upholds the bullish picture with a buy signal. This calls for traders to consider buying SUI manifested with the MACD line in blue, crossing above the orange signal line. As the momentum indicator gradually ascends above the mean line (0.00) into the positive region, the path with the least resistance stays on the upside.
How High Can SUI Price Go?
Despite the bullish outlook, traders should be cautious of a potential pullback, as profiteering may commence. Investors who bought SUI in the range channel may want to book profits if the uptrend weakens and a correction begins.
It might be prudent to watch out for the RSI’s rejection from the overbought region to time the reversal carefully and avoid the bull trap. In the meantime, the $2.27 support area will be in line to absorb the potential selling pressure. However, if the buying appetite persists, the SUI price could climb, reaching another new ATH at $3.50 soon.
Advertisement


