SUI Price Drops 7% as Analyst Accuses SUI Foundation of Insider Selling

Cryptocurrency trading is speculative and your capital is at risk when you trade. We may earn affiliate commissions from some of the products on this page - at no extra cost to you.

Highlights:
- SUI price plummets 7% as Lightcrypto, an on-chain analyst, accuses SUI foundation of Insider selling.
- SUI Foundation has denied the allegations, clarifying that no insiders or affiliated entities sold $400 million worth of tokens.
- The SUI volume and Open Interest indicate a shift in SUI’s price direction.
The SUI price has dropped 7.01% today, with the SUI/USD trading at $2.03 at the time of writing. Despite the plunge, its 24-hour trading volume has surged 46% to $1.38 billion, suggesting intense market activity. SUI is now up 8% in a week, 87% in a month, and 397% in a year, gaining a spot among the fastest-growing tokens.
Advertisement

The recent drop in SUI price comes following Lightcrypto, an on-chain analyst who accused the SUI Foundation of insiders selling $400 million worth of tokens. Light has claimed that Sui insiders are bypassing lockup agreements and trading tokens ahead of schedule. However, the SUI Foundation has denied the allegations, clarifying that no insiders or affiliated entities sold $400 million worth of tokens.
Sui Network has denied allegations of insider selling during the recent price surge, clarifying that no insiders or affiliated entities sold $400 million worth of tokens. The foundation also stated that token lock-up periods are monitored by qualified custodians and remain…
— Dehua (@DehuaFi) October 15, 2024
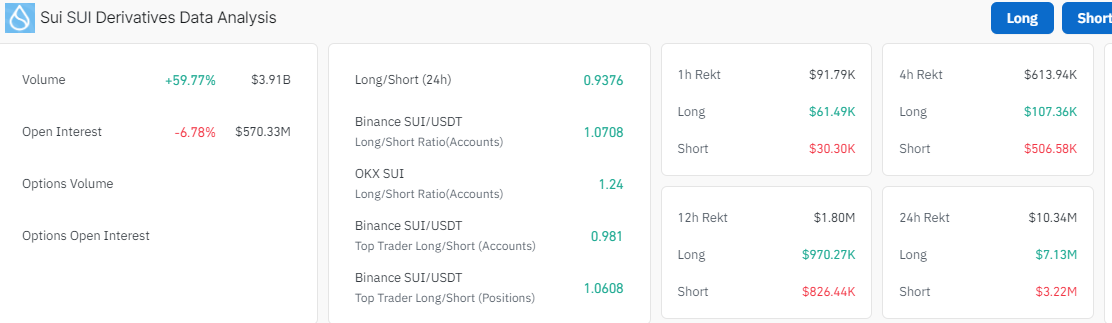
Meanwhile, SUI’s recent surge in trading activities suggests a positive sentiment in the market. Coinglass data indicates a significant uptick in SUI’s trading volume by 59% to $3.91 billion over the last 24 hours, suggesting renewed investor interest. However, SUI’s Open Interest (OI) has also plunged by 6.78% to $570.33 million. This indicates that there is a potential shift in sentiment or a lack of confidence in SUI’s price direction.
SUI Statistical Data
Based on CoinmarketCap data:
- SUI price now – $2.03
- Trading volume (24h) – $1.38 billion
- Market cap – $5.74 billion
- Total supply – 10 billion
- Circulating supply – 2.76 billion
- SUI ranking – #18
After days of painting the market green, SUI just took a 7.01% dip—its first sharp correction. This comes after SUI riding high for over a week, so a re-correction like this was bound to happen. Currently sitting at $2.03, this dip seems more like a pause before the bulls initiate the next upward movement.
The SUI price trades well within a rising parallel channel as the bears have tested the lower boundary of the pattern. The bears have notably breached the $2.06 support level, which coincides with the 50-day SMA. However, SUI sits above the 200-day Simple Moving Average (SMA) (blue), supporting $1.68. This outlook suggests mixed reactions in the market as the bears and bulls struggle to take control, with either giving in.
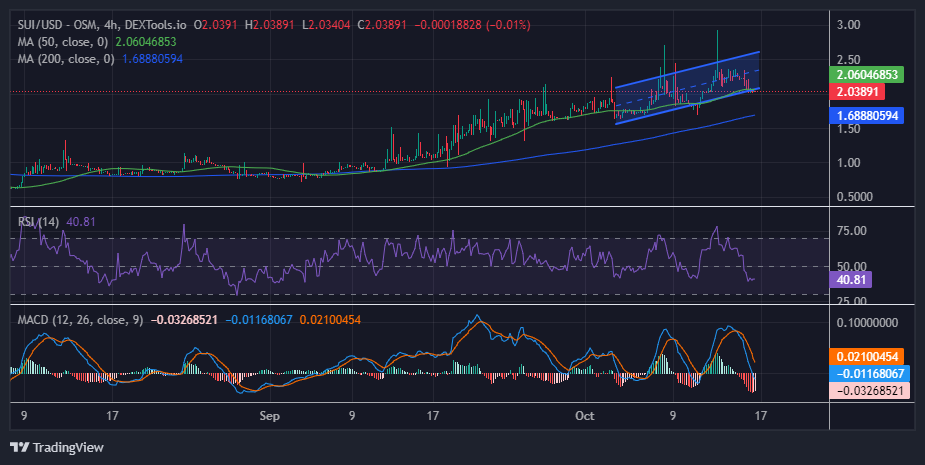
With the position of the Relative Strength Index (RSI) at 40.81, the SUI price may need a catalyst to resume an uptrend in the market. Holding the $1.68 support intact might encourage investors not to sell for short-term profiteering but to focus on the potential gains targeting $2.06 and $3, respectively. Meanwhile, the RSI sitting below the 50-mean level suggests that the bears have the upper hand.
On the other side of the fence, the Moving Average Convergence Divergence (MACD) introduces a bearish outlook on the four-hour chart. A sell signal manifested when the blue MACD line flipped below the orange signal line, revealing that declines should be expected before SUI rebounds above $2.06.
What’s Next for SUI Price?
The technical information in the SUI market upholds a bearish outlook, tilting the odds in favor of the sellers. If the bears capitalize on the MACD, which calls for traders and investors to sell, the token could drop further. On the downside, a breach below the lower trendline will result in the SUI price retesting the $1.84 support level.
On the upside, if a strong tailwind builds behind SUI, the token can obliterate the next critical resistance shown by the 50-day SMA (green) of $2.06. Note that gains above this price point could begin a meaningful uptrend, starting with a step to the $3 level ahead of a more significant breakout to $5.
Advertisement


