Strike Price Skyrockets 120%, Solidifying Its Position Among Top Gainers as Bulls Target $18

Cryptocurrency trading is speculative and your capital is at risk when you trade. We may earn affiliate commissions from some of the products on this page - at no extra cost to you.

Highlights:
- STRIKE hits $16.82 with $2.2B in volume.
- Launched testnet, mainnet, and $STRIKE staking.
- Stabilize v1, mobile launch, and perpetual rollout.
The Strike price has soared 120% in the last 24 hours to trade at $16.82 as of 7 a.m. EST, on a 100,924% pump in trading volume to $2.2 billion. Data from Coingecko indicates this jump in price has placed STRIKE among the top gainers, cryptocurrencies by market capitalization.
Advertisement

Top Gainers Today on CoinGecko 🚀
Here are the tokens that are the largest gainers among the top 1,000 #crypto, with $STRIKE, $AQT, and $PIPPIN leading the pack.
Are you watching any of these?https://t.co/GveeWYVU9d pic.twitter.com/NJWy25B1ut
— CoinGecko (@coingecko) January 9, 2025
The strike was the first derivatives platform on Cardano, launched in May 2024. The first year has seen some key milestones reached: the public testnet launch, one of the most successful token sales on Cardano, open-sourcing all contracts, and auditing forwards. It also launched its first mainnet product, $STRIKE staking.
Looking ahead to 2025, Strike is looking to stabilize the v1 mainnet, release the mobile version, support CNT, and enhance UI/UX for forwards and staking. The perpetual remains on track for the testnet this month, with the full-scale rollout of perpetual and options in what promises to make 2025 a great year. The team is grateful to all who have supported them on the way to this success.
Strike Statistics
- Strike price: $16.82
- Market Cap: $88.50Million
- Trading Volume: $2.26Billion
- Circulating Supply: 5.43Million
- Total Supply: 6.54Million
Strike Price Spikes with Sharp Bullish Candlesticks
This 4-hour STRIKE/USD trading pair chart shows some key price action, indicators, and chart patterns. At the time of writing, the price is sitting at $17.26, retracing -13.22% from the peak of $21.91.
Before the sharp rally, the price consolidated between $6.50 and $7.50, forming a strong base. This consolidation served as a launchpad for the subsequent parabolic move. The consolidation zone has now become key support, besides $8.50, corresponding to the 200-day MA. Resistance is at $18.00, and the local high of $21.91.
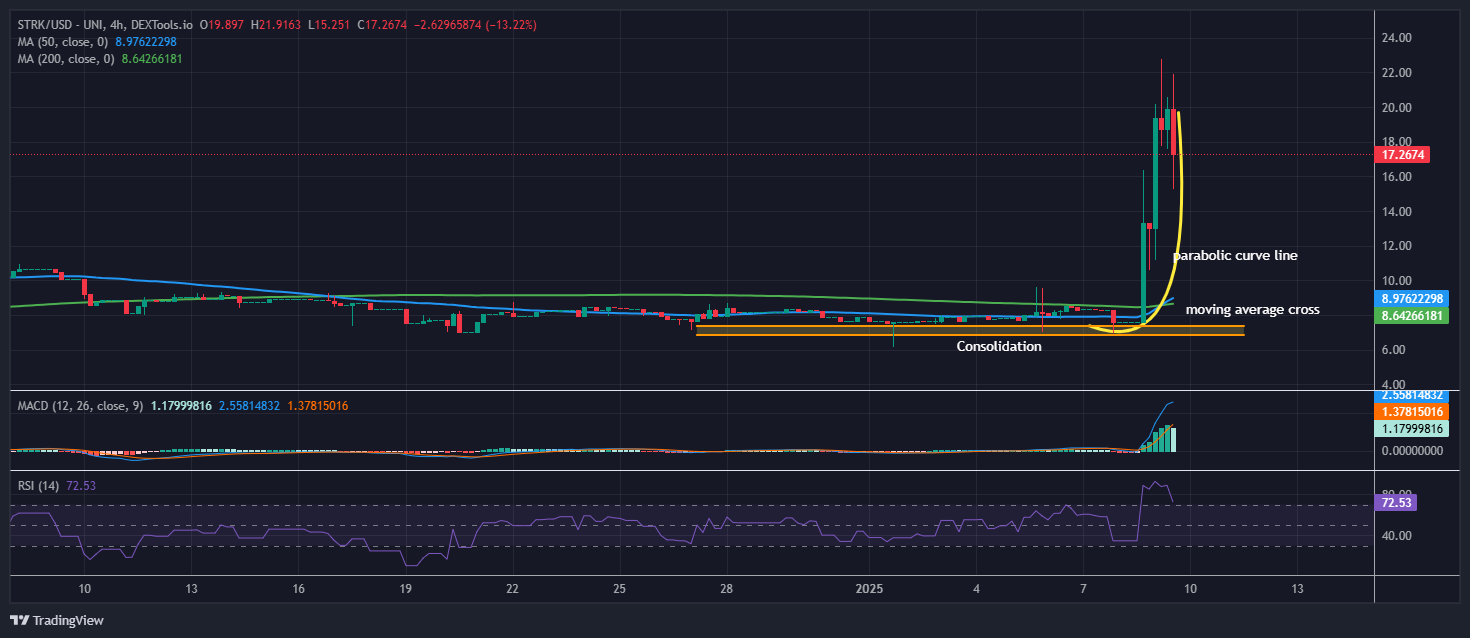
A golden cross formed when the 50-day MA at $8.97 climbed above the 200-day MA at $8.64, a buy signal. This was also when the parabolic move started. However, such moves are hardly sustainable, as seen by the sharp pullback from $21.91.
The MACD line is 1.77, the signal line is 1.37, and a narrowing positive histogram indicates weakening bullish momentum. This sharp rise in MACD reflects the recent explosive rally; however, the falling histogram suggests the probability of a reversal or a cooling-off period.
Bullish Technicals Point to a Short-Term Correction
The RSI (14) has climbed to 72.53 and has now entered the overbought zone, which indicates that the asset has become overpriced for the short term. This tallies with the correction in price currently underway. As displayed in the recent rise, a parabolic curve shows how swift the uptrend has been; such usually suffers violent corrections due to over-stretching.
If the price stays above $15.00, consolidation could occur before attempting a retest of the $21.91 resistance. The sustained buying pressure may take the price towards $25.00. If the price breaks below $15.00, it could fall further toward the $12.00 level or even toward the moving averages around $8.50 to $9.00.
The bullish trader may look to buy a bounce around $15.00 or wait for a confirmed breakout above $18.00, placing stop-losses near $14.50. The bearish trader may target a move to $15.00 or $12.00 with stop-losses above $18.50.
![]()
eToro Platform
Best Crypto Exchange
- Over 90 top cryptos to trade
- Regulated by top-tier entities
- User-friendly trading app
- 30+ million users
![]()
eToro is a multi-asset investment platform. The value of your investments may go up or down. Your capital is at risk. Don’t invest unless you’re prepared to lose all the money you invest. This is a high-risk investment and you should not expect to be protected if something goes wrong.
Advertisement


