Solana Price Surges 8% as Bullish Indicators Signal a Rally to $245


Highlights:
- Solana price surges 8% to $196, as trading volume rises 125%.
- CMB International has executed a Hong Kong-Singapore asset manager mutual fund by tokenizing it across Solana.
- Bullish technical indicators suggest a potential rally to $245 soon.
Solana price has smashed the $200 mark, before slightly retracing to $196, marking an 8% surge. Its daily trading volume has notably soared 125% to $13 billion, signalling heightened market activity.
Advertisement

Meanwhile, one of the biggest asset managers in Asia, CMB International, has executed a Hong Kong-Singapore asset manager mutual fund by tokenizing it across Solana. This move is historic, as it is the initial public offering on the Solana blockchain. This is a great indication of the growth in using blockchain technologies in conventional financial markets.
🚨 JUST IN: 🇨🇳 🇸🇬 CMB INTERNATIONAL ($1T+ AUM), TOP ASSET MANAGER IN ASIA, HAS TOKENIZED CMB’S HK-SINGAPORE MUTUAL FUND ON @SOLANA.
THIS IS THE WOLD’S FIRST PUBLIC FUND ON THE SOLANA CHAIN, HOLDING SIGNIFICANT IMPORTANCE IN ASIA’S FINANCIAL MARKETS! HUGE!#SOLANA ⚡️ pic.twitter.com/Z5BQz2LjHL
— curb.sol (@CryptoCurb) August 13, 2025
The performance of Solana in the market has been outstanding as the coin has been characterized by strong trading volume and growing open interest. According to the recent statistics on the derivatives market of Solana, the value of trading has increased by an impressive 109.78% to $53.93 billion. The value of other significant measures of the open interest, which indicates the total volume of open contracts, has also increased by 11.19% to $11.36 billion. This increase in volume and open interest indicates that there is a growing trust that traders have managed to achieve in the price trend of Solana.
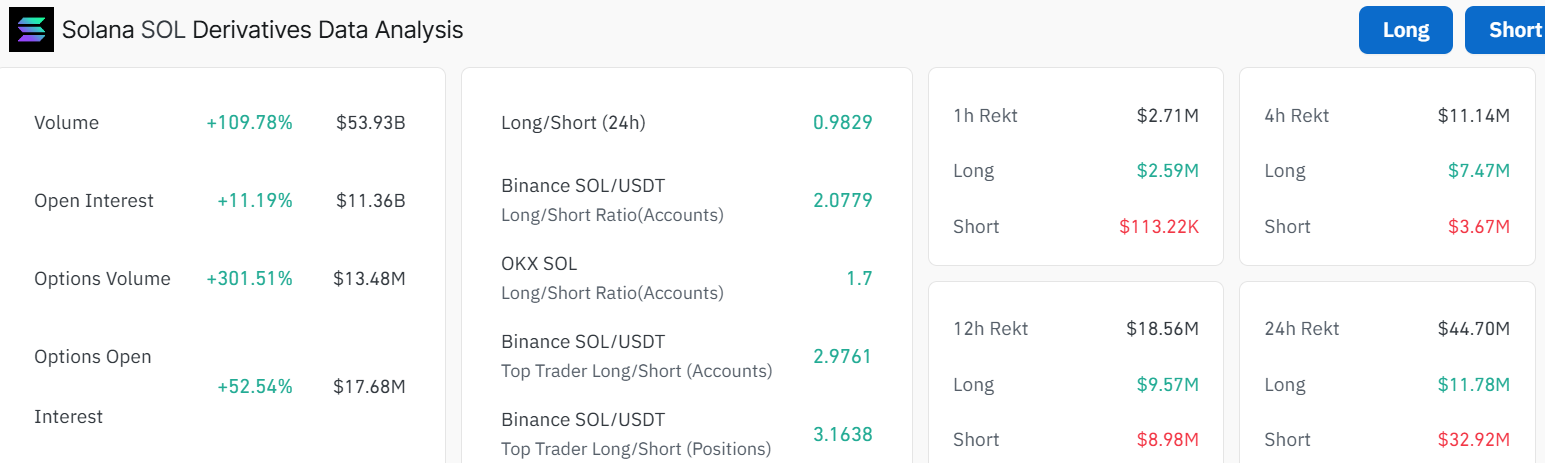
Another indicator of the bullish grip in Solana is presented in its Long/Short ratio in 24 hours, which sits at 0.98. This shows a balanced market sentiment with a slight persuasion to optimism since the long and short values fall nearly equal to each other.
Solana Price Poised for a Rally Above the Cup and Handle Pattern
The 1-day chart timeframe for Solana price shows a wild ride. The price recently dipped brake towards $200, before slightly plunging to $196. The 50 SMA (Simple Moving Average) at $168 and the 200 SMA (blue line) at $158 suggest a longer-term upward trend, as they act as immediate support zones. The cup and handle pattern further confirms a bullish outlook, as bulls aim for more upside.
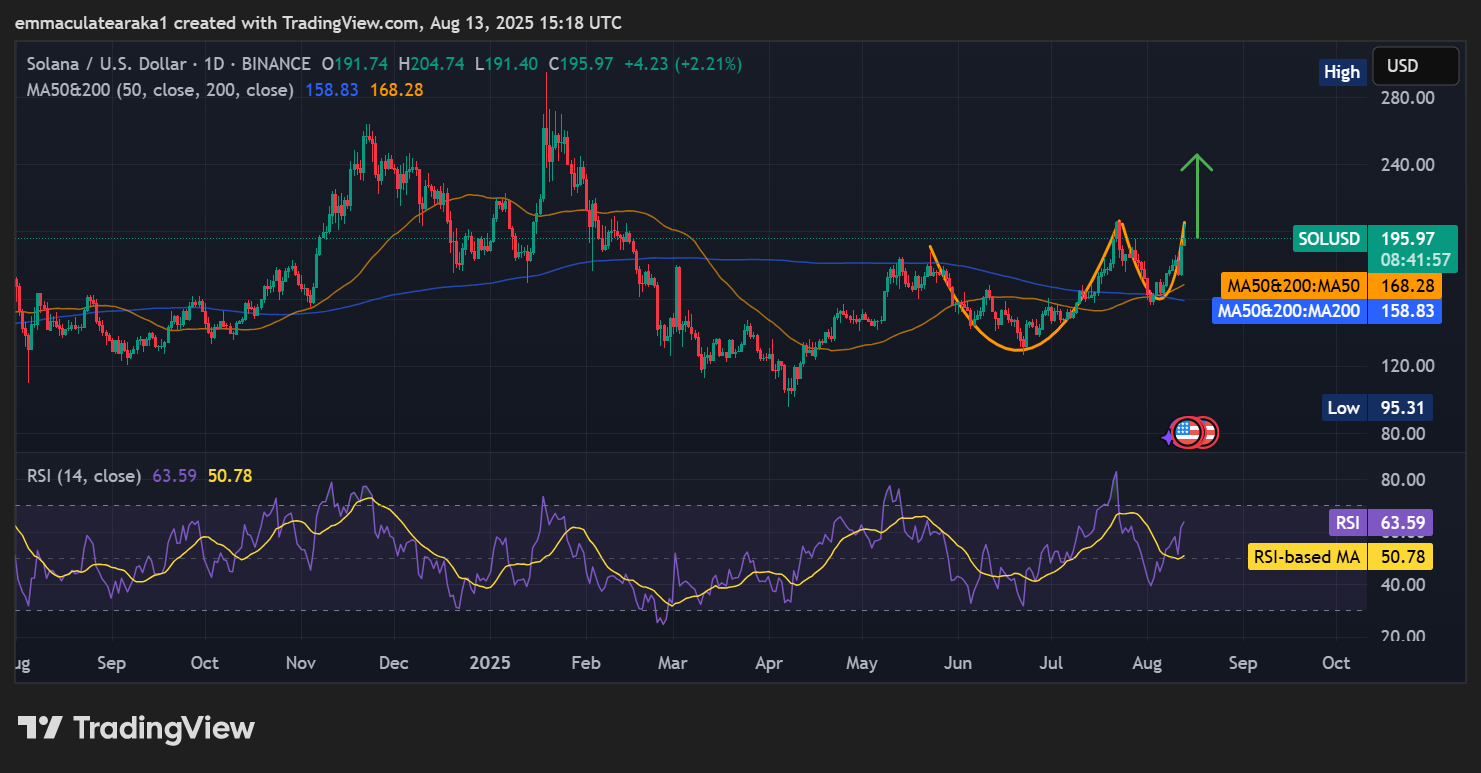
The Relative Strength Index (RSI) at 63.59 is headed upward, and is almost in the overbought territory, but not there yet. This indicates room for more gains, calling for more traders to hop on the Solana train. Meanwhile, the Moving Average Convergence Divergence (MACD) shows a bullish crossover, with the MACD line (blue) slicing through the signal line (orange). The chart highlights a resistance around $206, and if Solana price smashes through, it could moon toward $248 or even $270 if the bulls keep pushing.
SOL Bulls Eye $245 Level in the Short Term
In the short term, traders can expect more upside towards the $245 mark. With the RSI leaving more room for the upside, reinforced by the cup and handle pattern, the bullish sentiment is evident in the market. If the bulls break past $220 mark, a rally towards $245-$270 area could be imminent. In the long term, if this breakout sticks, Solana price could eye $300 or higher by Q4 2025. However, the overbought RSI level means flash crashes are possible, so traders should keep an eye on the charts.
![]()
eToro Platform
Best Crypto Exchange
- Over 90 top cryptos to trade
- Regulated by top-tier entities
- User-friendly trading app
- 30+ million users
![]()
eToro is a multi-asset investment platform. The value of your investments may go up or down. Your capital is at risk. Don’t invest unless you’re prepared to lose all the money you invest. This is a high-risk investment, and you should not expect to be protected if something goes wrong.
Advertisement


Emmaculate Araka
Emmaculate Araka is a cryptocurrency writer with published works on Crypto2Community and other news sources. She is believer in the transformative power of crypto and the blockchain industry, conducting on-chain analysis, breaking down market-triggering events, and helping traders and investors benefit from expert technical price analysis. Emmaculate finds gratification in diving deep into the crypto space, earning herself significant knowledge and experience. She holds a Bsc. in Information Science, and outside work, Emmaculate loves reading novels and watching documentaries.
View full profile ›ℹ️About Crypto2Community's Editorial Process
Crypto2Community's editorial policy is centered on delivering thoroughly researched, accurate, and unbiased content. We uphold strict editorial policy and sourcing standards, and each page undergoes diligent review by our team of top crypto industry experts and seasoned editors. This process ensures the integrity, relevance, and value of our content for our readers.