


The Solana price has jumped 38% in the past month and 6% in the last 24 hours to trade at $194 as of 3:30 a.m. EST, on a 31% plunge in trading volume to $2.8 billion. Since the current bull run began in late 2023, Solana’s [SOL] price surged over 850% by March 2024, skyrocketing from $20 to $210, a rare 10X gain many crypto traders dream of.
However, market challenges in Q2 pushed SOL below $150, breaking through key multi-month trendline support that had been in place since last year. Now, SOL seems poised to reclaim that previous trendline support, sparking hopes for more gains for the altcoin. Analysts are hopeful about Solana’s future. They believe the current price surge will keep going and might even push SOL above $200 again.
Advertisement

Solana looks ready to make new ATHs. pic.twitter.com/CjfoDmuh54
— Mister Crypto (@misterrcrypto) July 28, 2024
Solana Price Statistics
- Solana Price: $194
- Market Cap: $89.86Billion
- Trading Volume: $3.12Billion
- Circulating Supply: 464.71Million
- Total Supply: 581.04Million
Bulls Signal a Bullish Momentum Ahead
Solana’s price initially dropped to a key support level of about $157 but fell further to $135. This movement hit the lower edge of the consolidation zone and formed a triple bottom pattern, which traders often interpret as a sign of a potential bullish reversal.
The current support level has provided a springboard for the bulls to push the price up to $185. If the price breaks through this level, it could signal a rally that might lead to new all-time highs.
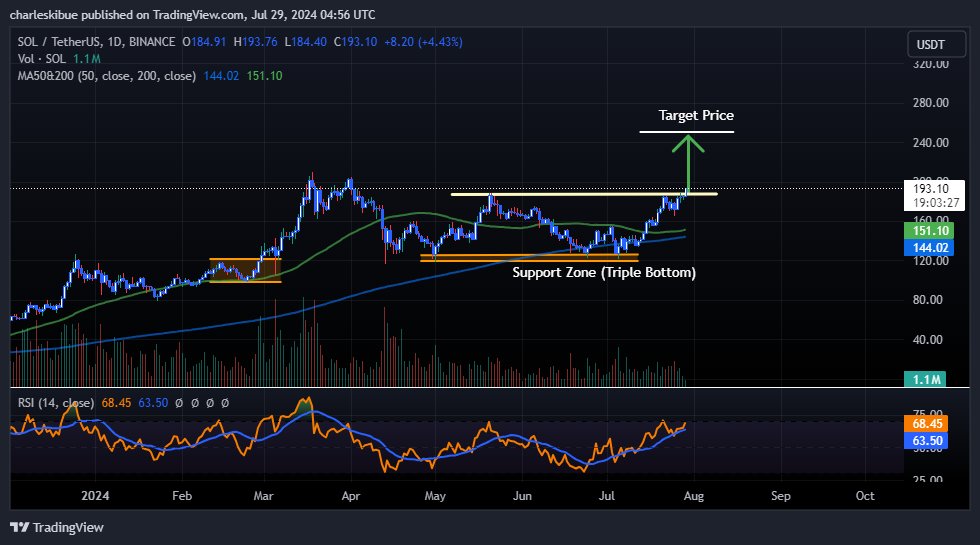
The price is currently trading above the 50-day and 200-day Simple Moving Averages (SMAs). If market sentiment continues, it might help the bulls drive the price above the $185 level, potentially sparking a strong rally. The Relative Strength Index (RSI) rebounded from 34, below the 50 neutral levels, to 67, near the overbought zone, indicating intense buying pressure. If bullish momentum builds, the RSI could rise and enter the overbought territory above 70.
Moreover, the Moving Average Convergence Divergence (MACD) indicates a bearish trend. The blue average line recently crossed below the orange signal line above the neutral level, indicating bearish momentum. Additionally, the histogram bars reflect negative price movement, reinforcing the bearish outlook.
Is a New ATH Within Reach?
The technical indicators for Solana are bullish and provide a springboard for a possible bull rally. If Solana’s price climbs above the consolidation zone, it could trigger this rally, with bulls aiming to reach the previous high of $225. A further push above this level could see the price reach a new all-time high above $260
However, there’s also a double-bottom pattern that could allow bears to push the price down, which would weaken the bullish outlook. If this happens, the price might return to the $163 support level.
Final Thought
The strong network traction could help Solana reclaim its previous trendline support. However, according to CryptoQuant data, key technical indicators are showing an overbought signal, suggesting a price reversal might be likely in the short term. The Fed’s rate decision on July 31st could confirm a clear move. A dovish stance could drive SOL above the uptrend line, while a hawkish announcement might delay its recovery.
Read More
- Next Cryptocurrency to Explode in July 2024
- Crypto Price Predictions
- Best Solana Meme Coins to Buy In 2024
- Ethereum Price Plummets 1% as Spot ETH ETFs Debut with $107 Million Net Inflows
- Pepe Price Surges 4% Primed for Bullish Rally After Spot Ethereum ETF Approval
- Bitlayer Secures $11M in Series A, Led by Franklin Templeton and ABCDE
- Coinbase Marks SEC Approval of Spot Ether ETFs as Crypto Milestone

Advertisement


