


The Solana price has painted the market green, as it has skyrocketed 4%, with the SOL/USD trading at $158 in the past 24 hours. The noticeable price movement is accompanied by its 24-hour trading volume, which has surged by 65% to $3.21 billion, suggesting increased market activity. SOL is now up 5% in a week, 9% in a month, and a whopping 737% in a year.
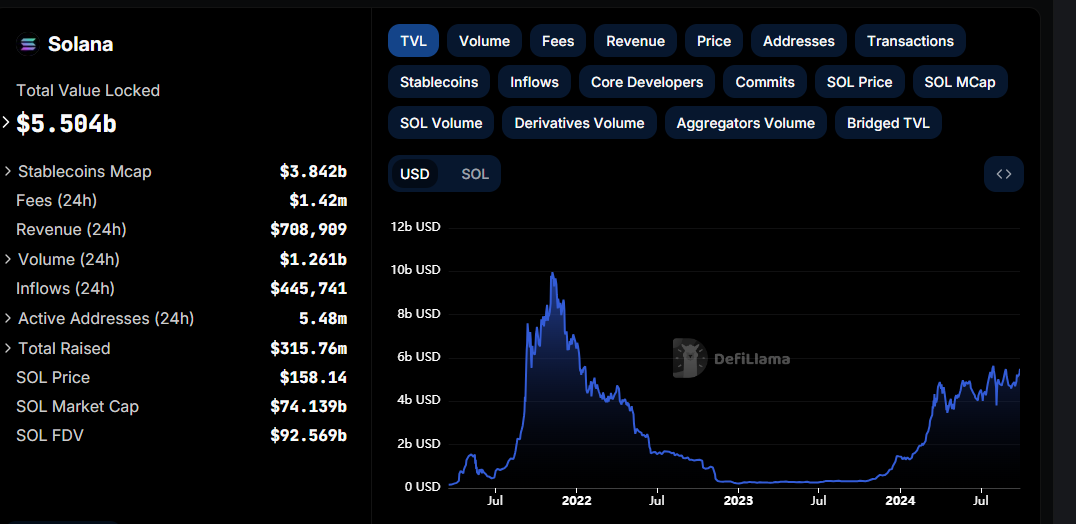
Meanwhile, data from DefiLlama indicates substantial activity in the Solana network, with 5.48 million active addresses in the past 24 hours. Additionally, the total value locked (TVL) of $5.504 Billion suggests increased engagement and investor confidence in the token. This vibrancy could be laying the groundwork for the anticipated upward price movements.
Advertisement

Solana Statistical Data
Based on CoinmarketCap data:
- SOL price now – $158
- Trading volume (24h) – $3.21 billion
- Market cap – $74 billion
- Total supply – 585 million
- Circulating supply – 468 million
- SOL ranking – #5
Navigating Solana Price’s Bullish Outlook
The Solana price is moving bullishly with the crypto market as the bulls take the reigns entirely. Chart analysis reveals a clear bottom formation around $120 in early September, followed by steady price growth. However, as expected, the investors and traders who bought SOL within the rising channel may commence early profit booking in the Solana market, resulting in a slight correction.
Meanwhile, the golden cross pattern on the 4-hour chart affirms the bullish grip. This pattern appears when a short-term moving average, like the 50-day SMA, moves above a long-term moving average, like the 200-day SMA.
Currently, the Solana price is sitting on top of confluence support formed by two key indicators: the 50-day Simple Moving Average (SMA) (green) at $148 and the 200-day SMA (blue) at $139. This suggests dwindling selling pressure, as the bulls have put their best foot forward, leaving the bears with dust.
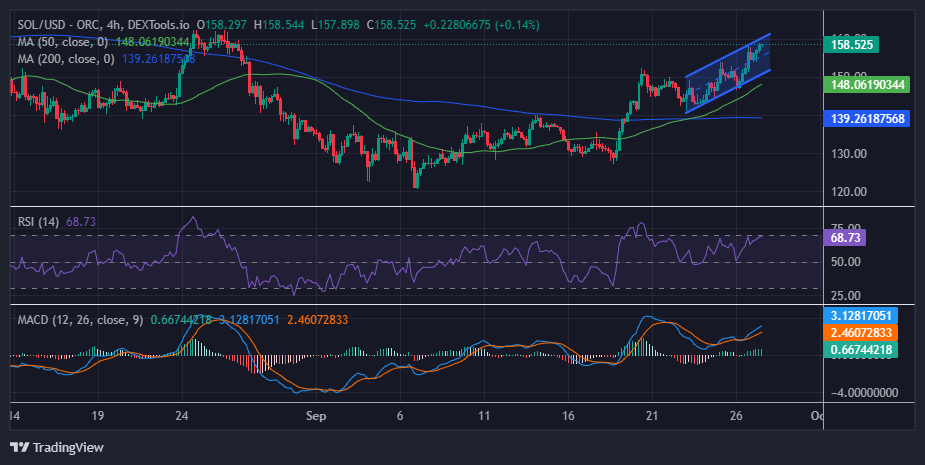
The Relative Strength Index (RSI) has hurtled above the 50-mean level, upholding a bullish picture. Currently, the RSI sits at 68.73. There is still room for potential upside before the RSI jumps into the 70-overbought area. Traders won’t have to worry about sudden pullbacks with the RSI above 70, as this position also means a correction is imminent.
Notably, the Moving Average Convergence Divergence (MACD) indicator upholds the bullish outlook and hints at the uptrend reaching higher levels at around $160. The buy signal is evident with the blue MACD line crossing above the orange signal line. Traders are inclined to continue buying SOL unless the trend in the MACD changes.
Can the Bulls Sustain the Momentum?
According to the technical information in the 4-hour chart above, the bulls control the SOL market. Meanwhile, the price could surge if the buyers capitalize on the MACD and RSI, which call for traders to rally behind SOL. If the 160 resistance is broken, the 172 and 188 levels can be observed, respectively.
On the downside, if the bears step in and the whole crypto market turns negative, the Solana price could drop. In case of a pullback, the support provided by the 50-day SMA at $148 would be instrumental in bulls desiring to arrest the bearish situation.
Advertisement


