


Highlights:
- SOL price soars 4% as bulls target the $200 mark.
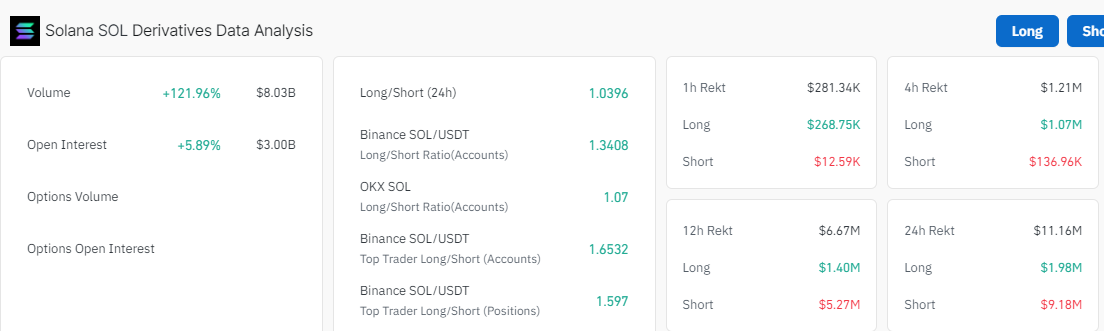
- Open interest and volume increase indicating a bullish outlook in the Solana market.
- The analyst predicts that SOL could break out, potentially hitting $370.
The Solana price has flipped bullishly today, elevating 4%, with the SOL/USD trading at $165. Immense volume backs the breakout, up above 100% on the day to $3.35 billion. This sudden interest in SOL tokens is also positively impacting its market capitalization, which according to Coinmarketcap, is up 4% to $78.33 billion.
Advertisement

Meanwhile, SOL’s recent surge in trading activities suggests a positive sentiment in the market. Coinglass data upholds a bullish outlook in the Solana market as the volume and open interest surge. The Open Interest (OI) in SOL is up 5.89% to $3 billion, while the volume has surged 121% to $8.03 billion. This indicates renewed interest in the token as investors’ confidence bolsters, painting the big picture bullish.
Moreover, traders and investors are optimistic about the SOL token, as they predict a potential break out to a new high. According to Moon, a well-known crypto trader has noted that ”SOL could go parabolic, potentially hitting $370.”
#Solana could go parabolic starting today! #Sol is breaking out of this MASSIVE Cup&Handle pattern with the potential target of $370 🎯 pic.twitter.com/qp31pbtJvS
— The Moon (@TheMoonCarl) October 21, 2024
Solana Statistical Data
Based on CoinmarketCap data:
- SOL price now – $165
- Trading volume (24h) – $3.35 billion
- Market cap – $78.33 billion
- Total supply – 87 million
- Circulating supply – 470 million
- SOL ranking – #5
SOL Price Aims for a Bullish Continuation Above $180
After a push-and-pull between the bulls and the bears in the Solana market, the SOL price has steadily increased, reclaiming the $165 mark. The Solana price has been on an upward trajectory since October 9, following the support establishment at $150. Bulls have taken the reins entirely as bulls dispersed the seller congestion in the market, forming a cup-and-handle pattern. Technically, this chart pattern is a bullish continuation pattern that marks a consolidation period before a substantial leg up.
Solana’s technical outlook turned bullish following the token’s rebound from support at $135. Between this support and the resistance at $160, bulls and bears waged a fierce tug-of-war. Using the 50-day Simple Moving Average (SMA) (green) at $144 and the 200-day(blue) at $150 as immediate support, bulls have rallied SOL, leaving the token in the resistance-free zone. SOL’s price uptrend touched $171 but has retreated to $165 in search of more liquidity to deal with the glaring seller congestion at $185.
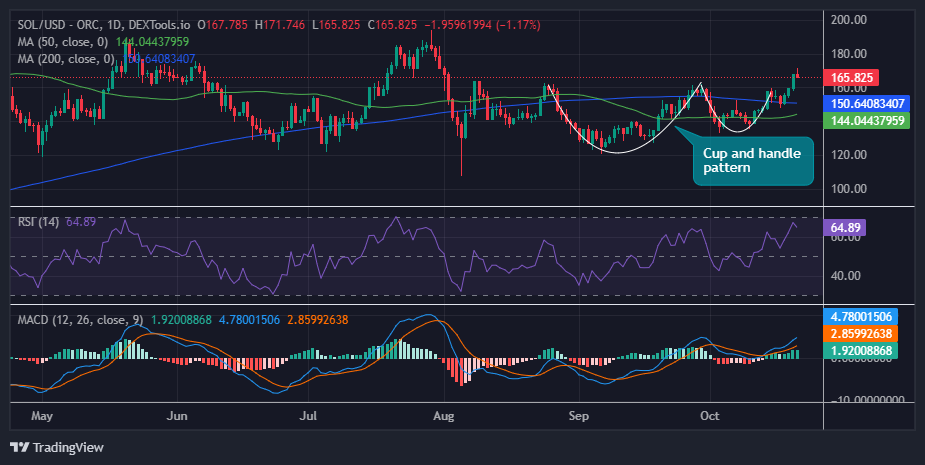
The Relative Strength Index (RSI) on the daily chart sits at 64.89, nearly in the overbought zones. This suggests that there is increased buying pressure in the SOL market. However, there is room for the upside before SOL is considered overbought.
Traders are at liberty to hold their long positions in SOL intact, bolstered by the bullish outlook from the Moving Average Convergence Divergence (MACD) indicator. A buy signal validated the rally, with the blue MACD line stepping above the signal line in orange. The momentum indicator has also been trending upwards into the positive region—above the mean line at 0.00. This means that traders are inclined to buy SOL unless the MACD changes.
Solana Price Prediction
The SOL price is upholding a splendid bullish muscle in the daily chart timeframe, tilting the odds in favor of the bulls. On the upside, if the bulls increase their buying appetite, the SOL price could reach the $200 mark if the $180 hurdle is weakened.
On the downside, if the bears step into the market and it turns negative, the SOL price could drop. In such a case, the $150 support level, coinciding with the 200-day SMA, would absorb the potential selling pressure.
Advertisement


