Solana Price Surge and Market Performance: A Path to Potential Rally


Highlight:
- Solana price rose 1.4% to $166, with trading volume at $4 billion and a market cap of $78 billion.
- The SOL/USDT chart shows an ascending triangle, signaling a potential breakout above $166.54, targeting a high of $175.
- The RSI is at 50.22, indicating neutral momentum with rising buying pressure.
The Solana price surged 1.4% in the last 24 hours to trade at $166 as of 6 a.m. EST, driven by a 6% surge in trading volume to $4 billion. Now, the market capitalization stands at $78 billion.
Advertisement

Solana has made an impressive recovery from its low in January 2023, reaching a peak of $212 in March. Although it hasn’t quite challenged its all-time high of $259 from 2021, it has still shown strong performance, especially compared to Ethereum’s Chainlink.
Solana has been trading within the $140 to $160 range over the past few months, showing a 10% increase since last September. The rising number of Solana wallet addresses could signal a strong rally toward $100 before the year concludes.
$SOL — moving towards $190🥬
The medium-term movement of SOL looks quite promising. The price broke above the average border of the long-term sideways trend and consolidated above $160 on the daily TF pic.twitter.com/1f7SRXLWGE
— CryptoCabbage2.0🥬🥬🥬 (@CryptoCabbage2_) October 22, 2024
According to crypto analyst CryptoCabbage2.0 on X, the medium-term trajectory of SOL appears encouraging, with the price having broken above the average boundary of the long-term sideways trend and consolidating above $160 on the daily timeframe.
Solana Statistics
- Solana price: $166
- Market capitalization: $78 billion
- Trading volume: $4 billion
- Circulating supply: 470 million
- Total supply: 586 million
Solana Continues May Continue the Uptrend
The chart above is the SOL/USDT on Binance in the 1-hour timeframe. For now, the SOL price is at $166.54, while the gain has increased to +0.43%. Price action has been building an ascending triangle, which, by definition, is a bullish pattern that should be expected to result in a breakout any time soon. In addition, the triangle resistance lies at about $166.54, meeting the 200-period moving average. If the price succeeds in breaking above the resistance, this would drive it toward the target zone of $175 or higher.
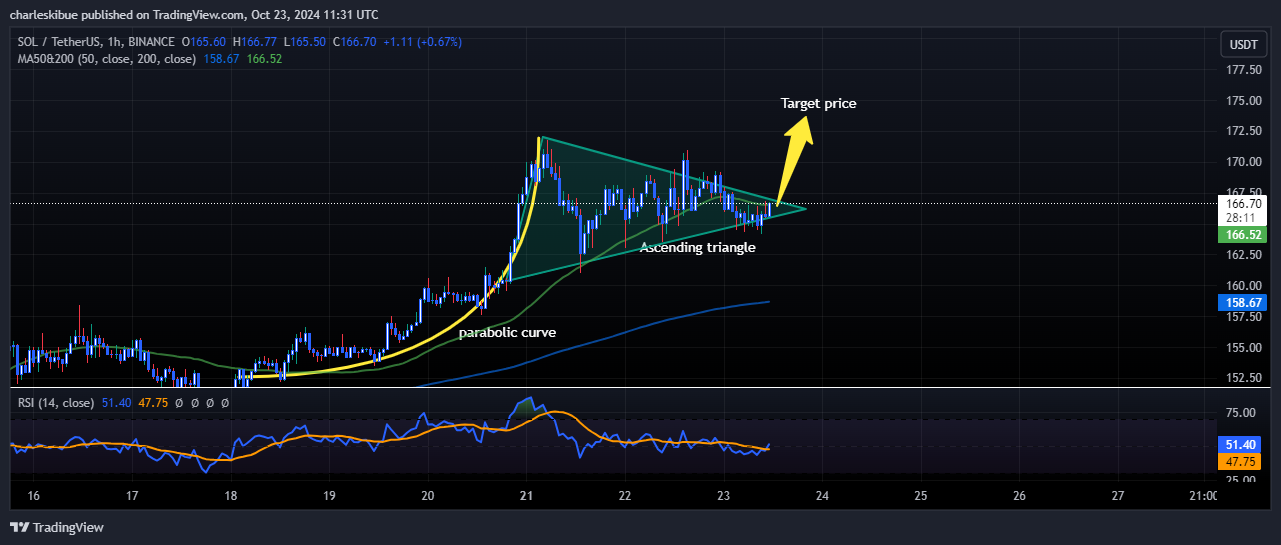
Potential Bullish Breakout as Solana Price Nears Key Resistance
Support-wise, the 50-period moving average rests at $158.62, providing strong short-term support. While this is the case, the 200-period moving average is sitting at $166.54, acting as dynamic support and showing that this price is a place of consolidation. Before the price was here, SOL was on a parabolic curve that provided the bullish momentum leading to the formation of the current ascending triangle.
The RSI is currently at 50.22, indicating neutral momentum. However, there is a slight upside from 48.03, which could mean an increase in buying pressure fairly soon.
Based on the current technical setup, SOL/USDT appears poised for a potential breakout if the price clears the resistance around $166.54, where the 200-period moving average converges with the ascending triangle’s resistance. If successful, SOL could rally toward the target price of $175 or beyond, supported by the bullish momentum from the earlier parabolic curve.
The RSI, at 50.22, shows neutral momentum but with a slight upward shift from 48.03, suggesting increasing buying pressure. If this continues, it could further fuel the breakout. However, if SOL fails to breach the resistance, it may consolidate between the $158.62 support (50-period SMA) and the $166.54 level.
Advertisement


Charles Kibue
Charles Kibue is a cryptocurrency researcher and writer with published works on Crypto2Community and a range of other sites. He has also worked as a technical writer, researching NFTs and crypto projects. Charles is an English Literature graduate residing in Kenya. He possesses additional expertise in market analysis and offers accurate and reliable insights, staying up-to-date with the latest developments in the crypto industry. Beyond his professional pursuits, Charles enjoys hiking and horse riding in his leisure time.
View full profile ›ℹ️About Crypto2Community's Editorial Process
Crypto2Community's editorial policy is centered on delivering thoroughly researched, accurate, and unbiased content. We uphold strict editorial policy and sourcing standards, and each page undergoes diligent review by our team of top crypto industry experts and seasoned editors. This process ensures the integrity, relevance, and value of our content for our readers.


