Solana Price Prediction: SOL Rises 14% with Key Support Holding and Possible Reversal Ahead

Cryptocurrency trading is speculative and your capital is at risk when you trade. We may earn affiliate commissions from some of the products on this page - at no extra cost to you.

The Solana price plunged 22.7% over the past week and increased by 14% in the last 24 hours to trade at $140 as of 5:11 a.m. EST. Trading also seems to have surged to an $11 billion price. The SOL price reached a crucial support level near $120 in yesterday’s trading, drawing notable bullish volume.
However, the current volume is less than half of the selling volume from the previous day, raising concerns. Additionally, the TD Sequential indicator is still showing a sell signal for Solana, indicating a potential decline below $135.
Advertisement

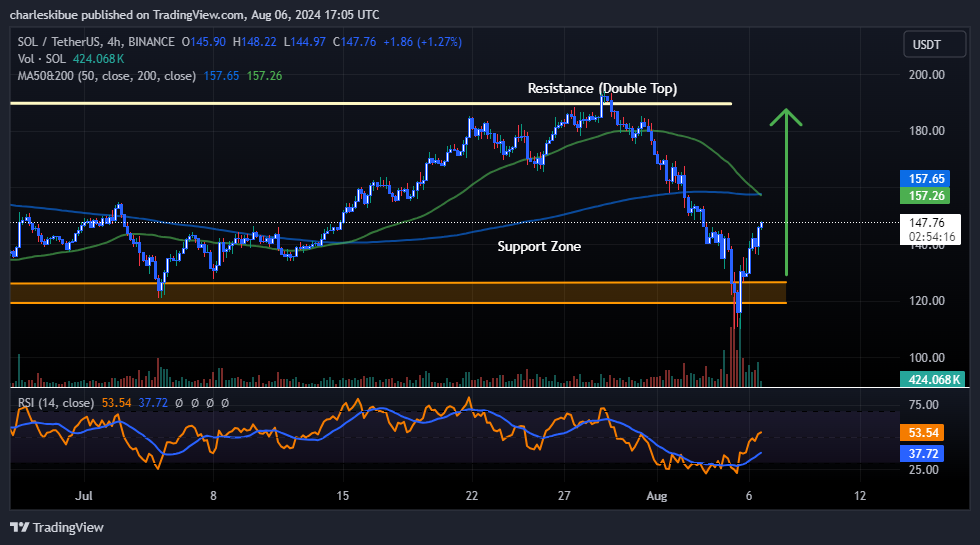
#Solana had the brief correction to around $135! Now, breaking $146 positions $SOL for $150-$166! https://t.co/IgfhDGGasO pic.twitter.com/TRRdI206jf
— Ali (@ali_charts) August 6, 2024
The TD Sequential indicator is currently bearish but also hints at a potential reversal if the price rises above $146, which could invalidate the bearish trend. Such a move might push the SOL price above $150, potentially reaching $166. Despite this, the token is still within a bullish range, so the next few days are crucial for assessing the potential rally in SOL’s price.
I looked 👀
It looks like SOL is going to break the resistance area which means the price gap between $SOL & $ETH will greatly increase in favor of Solana 📈If you're holding Solana you might be really happy degen 💖 https://t.co/hTsOttLnDh pic.twitter.com/D4tAbw5E3U
— Myth (@estimyth) August 6, 2024
Fortunately, SOL is maintaining a key support level over the long term, and the weekly candle remains green. This supports the possibility of a new all-time high (ATH) in the upcoming quarter, likely in Q4.
Solana Price Statistics
- Solana price: $140
- Market cap: $65 billion
- Trading volume: $11 billion
- Circulating supply: 465 million
- Total supply: 581 million
Solana Bulls Regain Strength: Can They Sustain the Momentum
Solana’s price is showing promising signs of a bullish rally. Recently, the bulls have regained momentum at $130, driving the price higher and trying to recover the recent downward trend caused by the bears. This movement has encouraged us that there is still hope for the falling wedge pattern that was recently formed, which indicated that there is a probability of a bullish cross-over being formed.
Technical analysis of solana indicates that the market is slightly trading below the 50-day and the 200-day simple moving average (SMA). All of this is about to change since the market is seen to be rising at the moment to try and surpass the 200-day SMA wish, which, in turn, will act as a support for the market. This will make it easy for the market to also surpass the 50-day SMA as long as the bulls continue with their momentum.
The relative strength index (RSI) also points to a potential bullish crossover. The RSI formed a spike after reaching the 30 oversold level, showing the potential for a strong bullish crossover. If the bulls continue showing strength in the market, the RSI might reach the 50 mid-line level and even surpass it.
Additionally, the moving average convergence divergence (MACD) indicator supports this bullish outlook. The histogram shows a decrease in the size of the red bars and also the fading of the color red, reinforcing the likelihood of a bullish crossover.
Solana price prediction
Despite the recent downturn, the bulls have shown resilience and are now trying to recover the losses made by the bears by pushing the price higher. They are now seen as aiming at a target price of $241. On the other hand, if the bears persist in their bearish trend, they will drop the market to a target price of $96.
Learn More
- Next Cryptocurrency to Explode in August 2024
- Toncoin Price Prediction 2024 – 2040
- Next 100x Crypto – 12 Promising Coins with Power to 100x
- Shiba Inu Price Forecast: Is $0.00002 Within the Reach Amidst Market Rebound?
- CoinDCX Establishes Crypto Investors Protection Fund

Advertisement


