


Highlights:
- The Solana price has soared 2% to trade at $127, as the crypto market stabilizes.
- On-chain data shows that Solana has reached a new all-time high of real-world assets (RWA) ecosystem of $873 million.
- The technical outlook shows building bullish strength as the SOL bulls eye $131 immediate resistance zone.
Solana (SOL) is trading around $127, marking a 2% increase over the past 24 hours. The on-chain data show that fundamentals are becoming stronger. This comes as Solana hit a new all-time high of real-world assets (RWA) ecosystem $873 million.
Advertisement

Meanwhile, the demand for the spot Solana Exchange-Traded Funds (ETFs) is strong and experiencing stable inflows since its inception. All these indicators are a positive sign for the near future of SOL, as the crypto market stabilizes.
Meanwhile, the Capital Markets data shows that Solana’s RWA ecosystem reached a new all-time high of $873 million in value on Thursday. This increase suggests growing institutional adoption and strengthening confidence in SOL’s real-world asset infrastructure.
Solana’s RWA ecosystem reached a new all-time high of $873M in value.
Tracked tokenized assets include:
– U.S. Treasury Debt
– Public Equity
– Institutional Alternative Funds
– Non-U.S. Government DebtEntering the new year, regulated and yield-bearing RWAs continue to expand… pic.twitter.com/fPapWA3Cgt
— Capital Markets (@capitalmarkets) January 1, 2026
On the other hand, the institutional demand for SOL has also been increasing since it was introduced on October 28. According to SoSoValue data, the net inflows recorded by spot Solana ETFs of $10.43 million this week, and it follows a series of weekly inflows since its establishment in October.
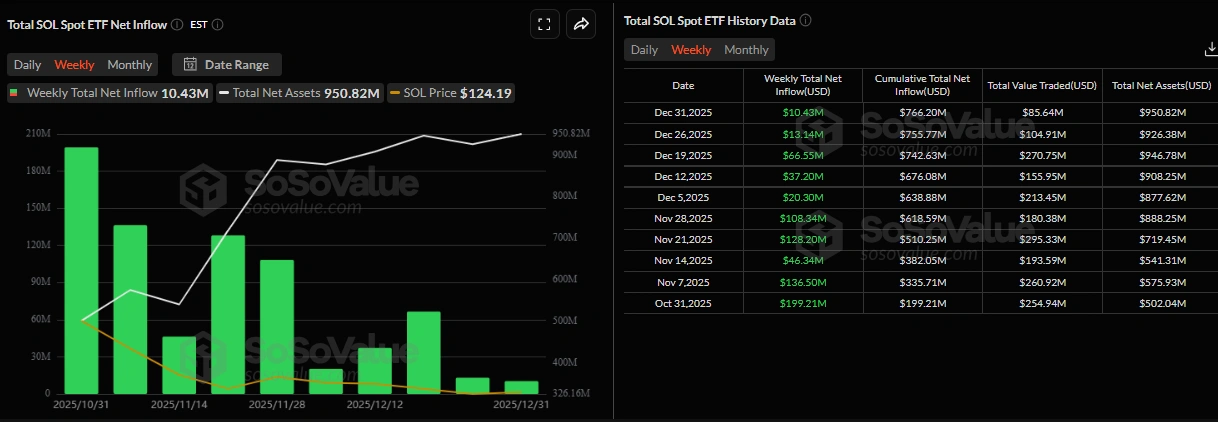
Further, the consolidation is characterized by an increase in the total net assets to $950.82 million as of Thursday. This implies that institutions are hoarding SOL instead of minimizing exposure.
SOL Bulls Eye $131 Resistance Zone, as Bulish Grip Builds
Looking at the Solana price daily chart, SOL has bounced from the $122 zone and is currently trading just above it at $127. The area around $122 is acting as the immediate support, while the next notable resistance is around $131, where the bulls are targeting soon.
If SOL breaks above this resistance, momentum could drive it towards the next key zone at $145-$167 before targeting the long-term barrier at $173. The technical indicators, like the 50-day Simple Moving Average (SMA), sit at $131, where the bulls must overcome to continue the upside movement. Notably, the 200-day SMA at $173 acts as the long-term barrier, in which, if the bulls break out, a bullish rally may resume.
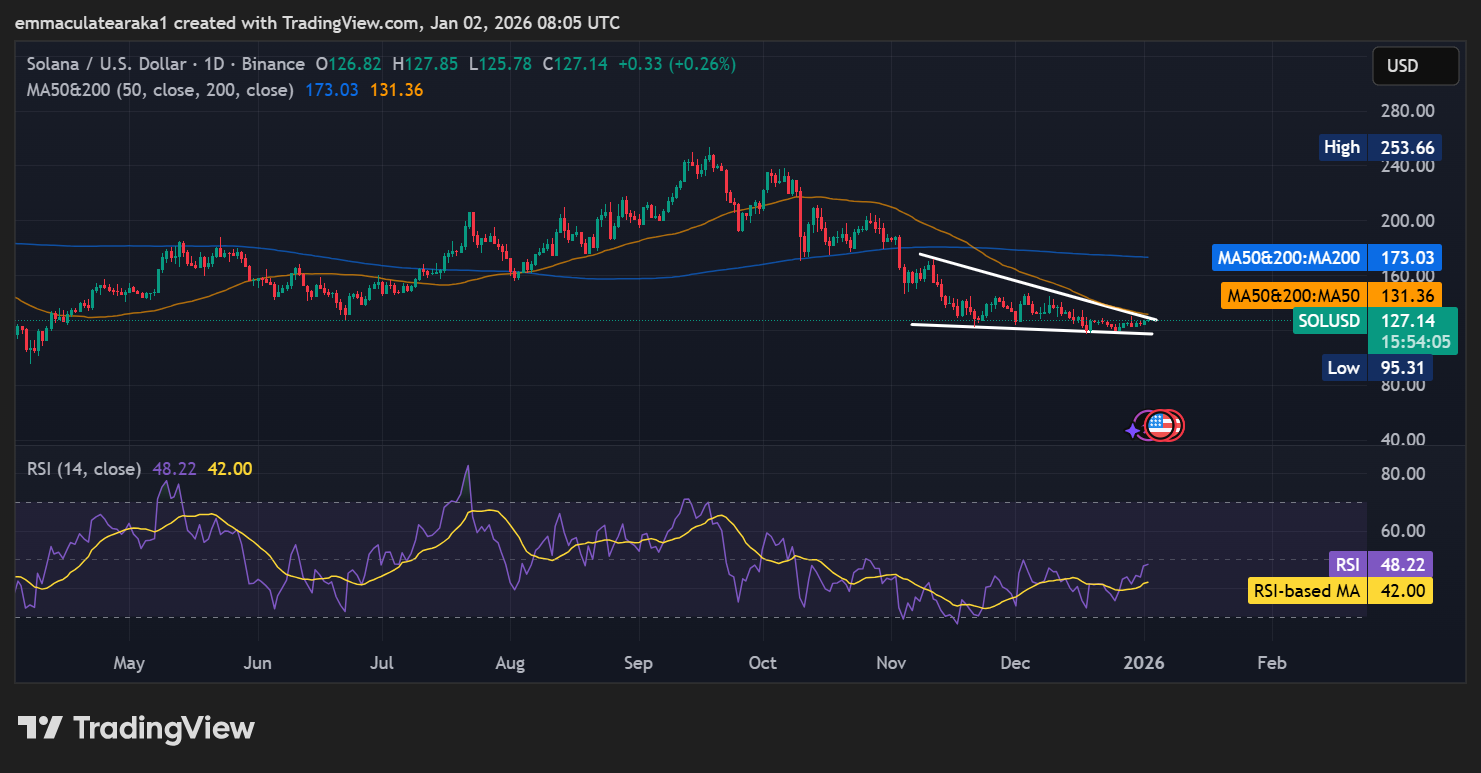
The momentum indicators, including the Relative Strength Index (RSI) at 48.22, show that SOL is building a positive momentum, but not overbought yet. The MACD is still bullish, with the main line above the signal, calling for traders to rally behind SOL.
If Solana price holds support at $122 and attracts more buyers, it could attempt another push above $131, which aligns with the 50-day SMA. In the event of a pullback, a push below $122 could see SOL slide towards $120-$116, where major buying interest is likely to emerge.
In the meantime, Solana’s recent 2% rise, institutional demand, and rising on-chain activity have created the perfect set-up for continued growth. Traders and indicators push Solana toward a $131 breakout.
![]()
eToro Platform
Best Crypto Exchange
- Over 90 top cryptos to trade
- Regulated by top-tier entities
- User-friendly trading app
- 30+ million users
![]()
eToro is a multi-asset investment platform. The value of your investments may go up or down. Your capital is at risk. Don’t invest unless you’re prepared to lose all the money you invest. This is a high-risk investment, and you should not expect to be protected if something goes wrong.
Advertisement


