

The Solana price has surged by 1%, currently trading at $138 on a 10% drop in trading volume to $3.4 billion.
The recent dip coincides with Analyst Will Clemente sharing a significant Solana price chart that contrasts Solana with Ethereum, showing a decline against ETH.
Advertisement

Solana’s performance in September showed a clear downtrend compared to Ethereum, indicating ETH was surpassing SOL. However, recent developments indicate a potential turnaround, as Clemente suggests a reversal could be on the horizon.
Another analyst, Ansem, predicts a quiet summer for Bitcoin and Solana, suggesting potential opportunities could emerge in the altcoin market.
The analyst’s views, emphasize the varied movements among cryptocurrencies and stress the importance of identifying compelling narratives that could lead to significant gains.
alts are in a few different spots atm, solana led for most alts since last October & is one of the only in the top 100 substantially green against BTC
for SOL, the march lows are still intact, so can make argument for consolidation sideways before more continued upside if those…
— Ansem 🧸💵 (@blknoiz06) June 18, 2024
Ansem noted that Bitcoin and Solana (SOL) maintained their highs in March, indicating a potential sideways consolidation before the next upward movement.
Solana Price Statistics
- Solana Price: $138
- Market Cap:$63 billion
- Trading Volume:$3.4 billion
- Circulating supply:461 million
- Total Supply:578 million
Solana Price Forms Double Bottom Pattern Amid Bearish Momentum
The Solana price plummeted sharply quickly, underscoring its strong bearish momentum. It initially fell to a critical support level of around $157.
However, it has since broken below this support, dropping further to $138 on the lower boundary of the descending wedge formation and forming a double bottom pattern, which traders look to for bullish reversal signals.
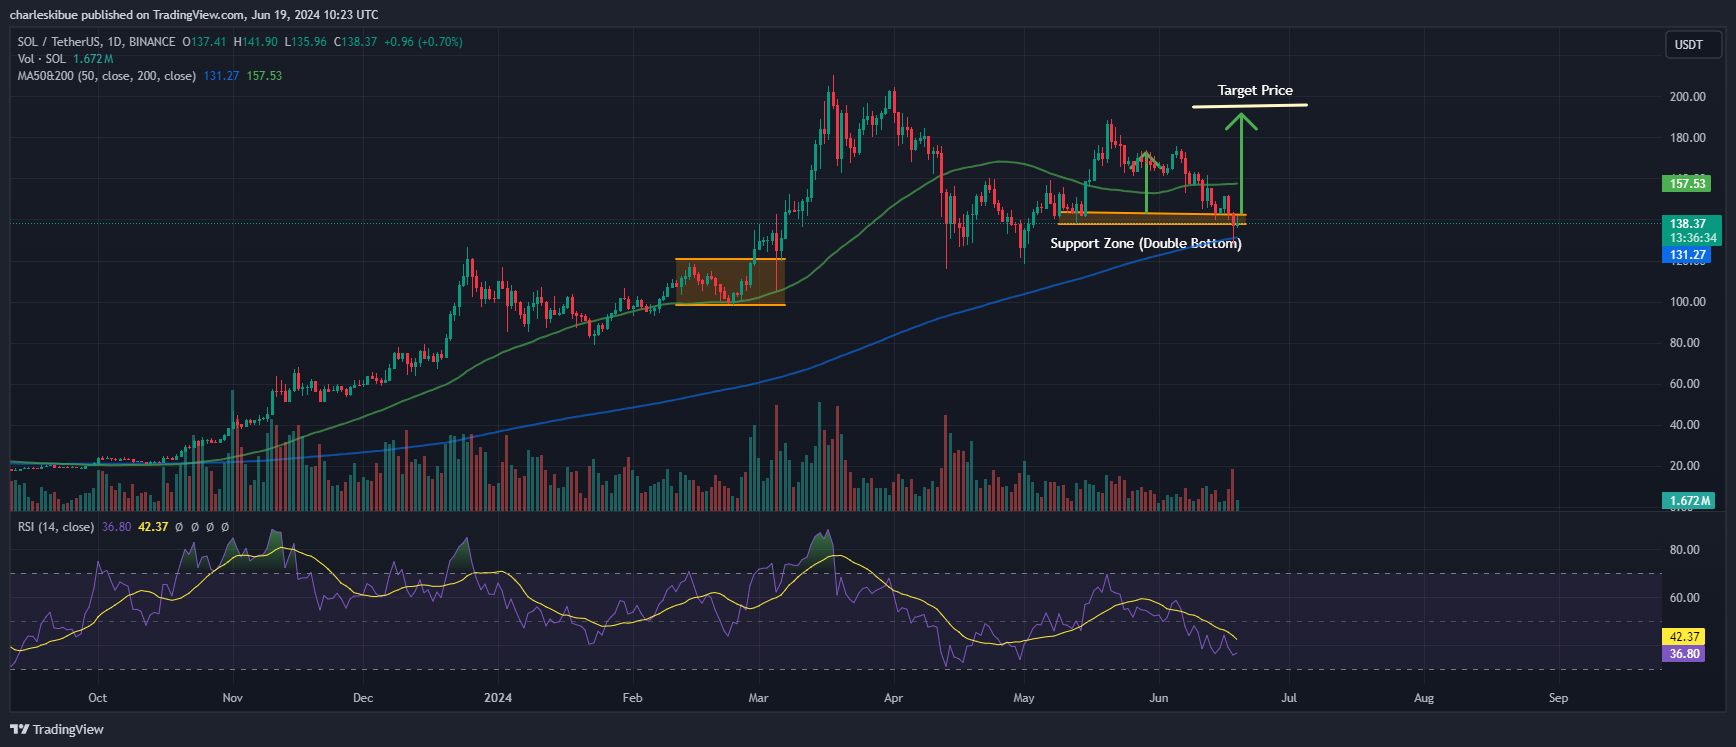
SOLUSDT Analysis (Source: Tradingview)
Solana’s price has fallen below the 50-day Simple Moving Average (SMA), where the 50 SMA now acts as a significant barrier to upward movement. This shift indicates a momentum favouring the downside.
However, if the broader market sentiment responds positively to the double-bottom pattern and turns bullish, bulls could drive the price back above both SMAs, potentially sparking a strong rally.
The Relative Strength Index (RSI) also shows a downtrend, currently hovering around the 38 mark, below the neutral level of 50. This suggests that selling pressure may be easing. If bullish momentum picks up, the RSI could rise, possibly entering the overbought territory above 70. Such a move would indicate increased buying interest and could support a bullish scenario for Solana.
Meanwhile, the MACD (Moving Average Convergence Divergence) indicator indicates a bearish trend. Recently, the blue average line crossed below the orange signal line around the neutral level, signaling bearish momentum. Additionally, the histogram bars depict negative momentum in price movement, reinforcing the bearish outlook.
Don’t Miss: Solana Price Prediction 2024 – 2040
Solana Price Prediction: Can The Bulls Initiate a Rally?
Even though Solana’s price has fallen from the $175 consolidation level and is currently trading below the 50 SMA, there’s still an upward trend in sight. The bullish momentum in SOL price could potentially push it back to around $205 in the weeks ahead.
However, if the bears continue to dominate below the 50 SMA, the bullish momentum might weaken, and the price could retreat towards the $126 support level.
SOL seems poised for a comeback as market dynamics could shift if Solana breaks through crucial resistance levels.
Learn More
- Ethereum Whales Active After SEC’s Favorable Decision
- 20 Top Cryptocurrencies to Watch for 2024 – Detailed Reviews
- Next Cryptocurrency to Explode in 2024
Disclaimer: Cryptocurrency is a high-risk asset class. This article is provided for informational purposes and does not constitute investment advice. You could lose all of your capital.


Advertisement


