

Solana(SOL) price is up 1% today, with the SOL/USD trading at $141. Its trading volume has notably surged 6% to $1.83 million, showing increased market activity. The growing interest in the token has seen it jump to the green zone, as the token boasts a 1% increase in the past week, 7% in a month, and a whopping 540% in a year.
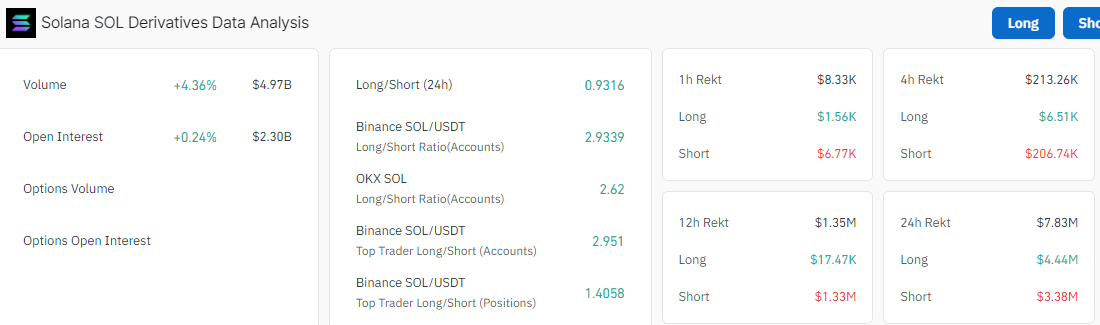
Solana’s recent surge in trading activities suggests a positive sentiment in the market. Coinglass data indicates a significant uptick in Solana’s trading volume by 4.36% to $4.97 billion over the last 24 hours, suggesting renewed investor interest. Moreover, Solana’s Open Interest (OI) has also increased by 0.24% to $2.30 billion. This increase in volume and OI adds to the bullish outlook, pointing to growing investor confidence in the cryptocurrency.
Advertisement

However, is Solana’s path to $200 clear? Let’s dive into the technical information and decrypt further.
Solana Statistical Data
Based on CoinmarketCap data:
- SOL price now – $141
- Trading volume (24h) – $1.83 billion
- Market cap – $66.65 billion
- Total supply –586.25 million
- Circulating supply – 469.54 million
- SOL ranking – #5
After a bullish wave traversed the crypto market, it triggered a surge in prices, led by Bitcoin’s jump above $64,000. However, early profit booking hampered the continuation of the uptrend for most cryptos, including Solana.
Solana’s price dwindled from the $151 level, like a dead weight in the air, with the bulls finding support at the $135 mark. This has resulted in the formation of a descending parallel channel in the Solana market.
Technical Indicators Show Mixed Reactions in the SOL Market
Meanwhile, the bulls are attempting to recover the market as they aim to break above key zones. Currently, the SOL price trades below the bullish indicators, including the 50-day and 200-dy Simple Moving Averages. In this case, the bulls must bring down the resistance levels at $142.13 and $142.58 in order to resume a strong move upwards.
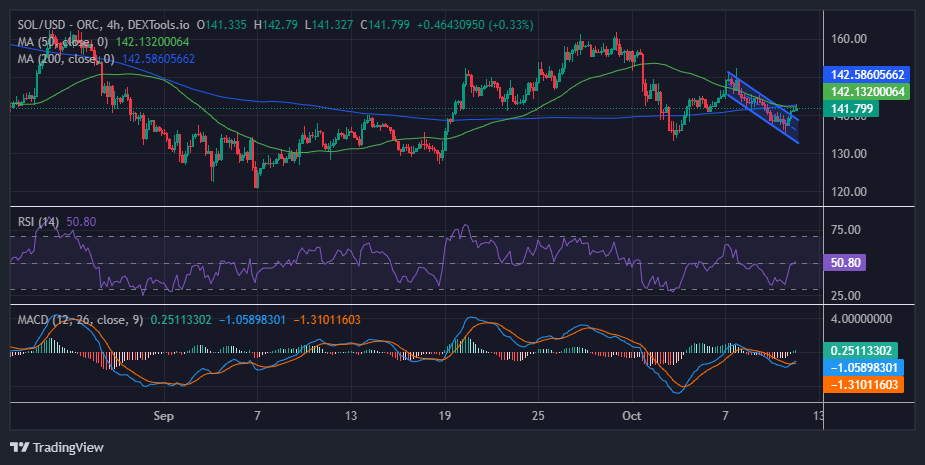
The Relative Strength Index (RSI) is sitting at the 50-mean level, suggesting indecision in the market. This means that the market is at equilibrium, as the bulls and the bears fight to take control, with either giving in. However, if the bulls gain momentum at this level, they could propel the RSI above the mean level and potentially to the 70-overbought zone.
On the other fence, the Moving Average Convergence Divergence (MACD) indicator upholds the bullish picture, calling for traders to rally behind SOL. This is evident as the blue MACD line has crossed above the orange signal line, validating the buy signal. Traders and investors are now at liberty to hold their long positions in SOL.
Solana Price Outlook
In the 4-hour chart above, the bulls and bears are engaged in a fierce tug-of-war in the Solana market. On the upside, if the bulls capitalize on the MACD, which calls for traders to buy more SOL, the price will surge. In such a case, if a strong tailwind builds behind SOL, the token can wipe out the next critical resistance shown by the 50-day and 200-day SMA at $142.
Note that gains above this price point could resume a significant uptrend, with the bulls targeting the next barrier at $152. In a highly bullish case, it could hit the $200 mark. On the downside, if the bears capitalize on the 50-day and 200-day SMAs, which show some bearish prospects, the SOL price will plunge. In such a scenario, the $133 support level will cushion against further losses.
Advertisement


