Solana Price Outlook: SOL Soars 7% as Open Interest and Volume Surge: What’s Next?


The Solana price has climbed 7% in the past 24 hours, with the SOL/USD trading at $139. Meanwhile, major cryptos like Bitcoin (BTC) and Ethereum (ETH) have notably gone ballistic by 4% and 6%, respectively, with major altcoins jumping to the green zone.
SOL is now up 3% in a week but has lost 5% in a month, although the cryptocurrency retains a healthy 586% gain in a year. Meanwhile, Solana Mobile has officially announced Solana Seeker, a next-generation Web3 smartphone set to launch in 2025.
Advertisement

A new chapter for Solana Mobile. Meet Seekerpic.twitter.com/9eIeHjGhir
— Solana (@solana) September 19, 2024
On the other hand, Coinglass data shows that approximately $8.81 million in crypto liquidations accompanied Solana’s return above $138. This included $6.18 M short SOL positions and $2.63 M long liquidations.
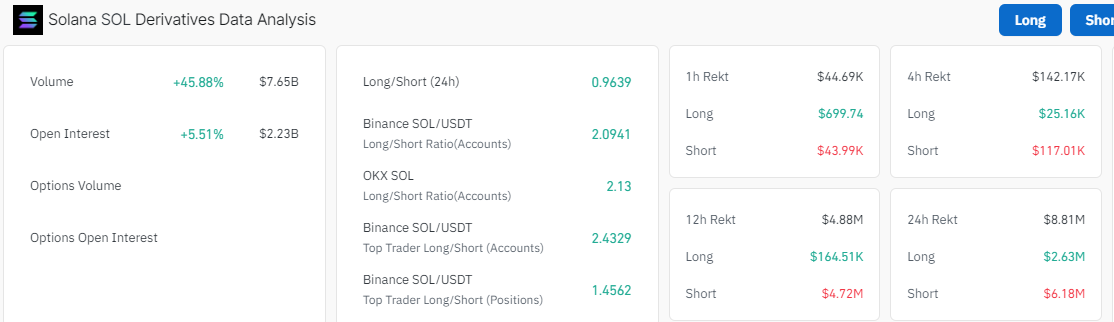
Furthermore, a 5% increase in Open Interest (OI) to $2.23 billion and a 45% volume increase to $7.64 million suggest that new money flows into the market. In other words, there is a potential shift in sentiment that could impact future price movements.
Solana Statistical Data
Based on CoinmarketCap data:
- SOL price now – $139
- Trading volume (24h) – $2.95 billion
- Market cap – $65 billion
- Total supply – 584 million
- Circulating supply – 468 million
- SOL ranking – #5
Solana Price Aims for a Break Out Above the Descending Triangle
The Solana price currently holds at $139, following a minor correction from its highs last August at $193. The daily chart shows a descending triangle pattern formation after SOL peaked at $193, followed by a significant retracement to $120.
This pattern, however, has allowed the price of Solana to consolidate and prepare for a strong leg up or breakout in the coming days. Meanwhile, initial buy orders should be placed after SOL steps above the triangle resistance and particularly above the resistance posed by the 50-day Simple Moving Average (SMA) (green). The current technical picture seems vital for a more significant breakout.
SOL trades below most bullish indicators in the short-term, with the 50-day SMA (green) and the 200-day SMA (blue) in line acting as immediate resistance zones. However, to be safe, bulls must conquer the $141 and $154 technical barriers to encourage already sidelined investors into the market without worrying about sudden corrections.
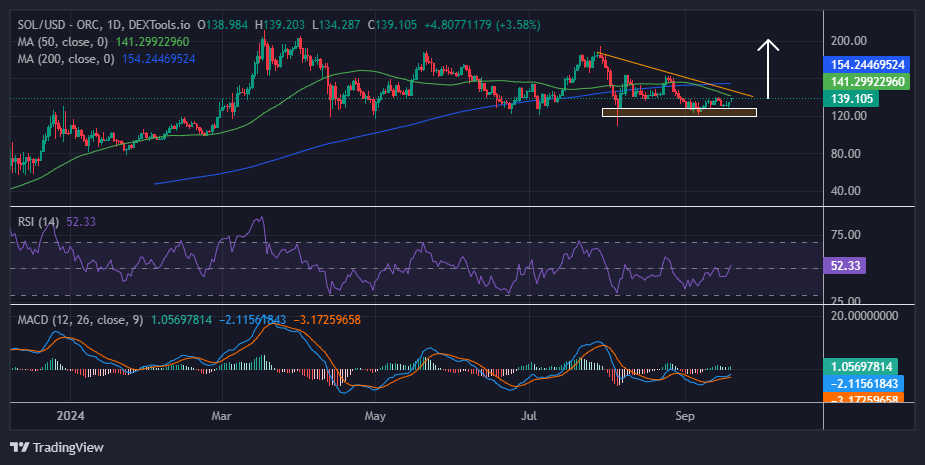
Moreover, the Relative Strength Index (RSI) is at an equilibrium level, suggesting that the token is neither overbought nor oversold. However, with the RSI above the 50-mean level, tilts the odds towards the upside. Increased buying pressure will see the RSI jump to 70-overbought, cementing the bullish thesis.
On the other fence, the Moving Average Convergence Divergence (MACD) indicator reveals that a bullish outcome is highly likely in the Solana market. Traders should consider rallying behind Solana, especially with the momentum indicator hurtling towards the positive territory, above the neutral 0.000 area.
Will the Bulls Break to the $164 Mark?
In the daily chart above, there is a tug-of-war between the bulls and the bears, however the odds seem to favor the upside. A subsequent breakout above the immediate resistance at $141 would pave the way for an uptrend. Moreover, if the bulls increase their buying appetite at this level, with the MACD and RSI suggesting a buying signal, the bulls would flip the $154 resistance into the support floor.
This would cause the SOL price to break out, potentially reaching the next resistance at $164 in the short term. In a highly bullish scenario, the SOL price would hit the $200 mark. On the downside, if the bears capitalize on the 50-day and 200-day Simple Moving Averages (SMAs) which suggest some bearish prospects, the SOL price could drop. In such a case, the $130 support zone would act as a cushion against further losses.
Advertisement


Emmaculate Araka
Emmaculate Araka is a cryptocurrency writer with published works on Crypto2Community and other news sources. She is believer in the transformative power of crypto and the blockchain industry, conducting on-chain analysis, breaking down market-triggering events, and helping traders and investors benefit from expert technical price analysis. Emmaculate finds gratification in diving deep into the crypto space, earning herself significant knowledge and experience. She holds a Bsc. in Information Science, and outside work, Emmaculate loves reading novels and watching documentaries.
View full profile ›ℹ️About Crypto2Community's Editorial Process
Crypto2Community's editorial policy is centered on delivering thoroughly researched, accurate, and unbiased content. We uphold strict editorial policy and sourcing standards, and each page undergoes diligent review by our team of top crypto industry experts and seasoned editors. This process ensures the integrity, relevance, and value of our content for our readers.