Solana Price Forecast As DeFi TVL Escalates: Can SOL Hit $200?

Cryptocurrency trading is speculative and your capital is at risk when you trade. We may earn affiliate commissions from some of the products on this page - at no extra cost to you.

Solana (SOL) has seen a mix of volatility and recovery over the past 24 hours. At the time of reporting, Solana price is trading at $136.88, marking a 1.81% decrease on the day. Despite this slight downtrend, the trading volume has surged by 41.68% to $1.8 billion.
Solana remains a top player in the cryptocurrency market, ranking 5th in market capitalization, which currently stands at $63 billion. SOL experienced a notable uptrend, reaching a peak at $140. This upward movement was driven by increased trading activity and positive market sentiment, indicating a strong interest from investors.
Advertisement

However, the uptrend was short-lived as the price soon encountered resistance, leading to a subsequent decline. Following the peak, SOL’s price fluctuated significantly throughout the day.
Despite multiple attempts to regain its earlier highs, the price faced downward pressure, ultimately stabilizing around $136. This pattern suggests a struggle between bullish and bearish forces, with the market unable to sustain the initial uptrend.
Solana Price Prediction: Can It Break Past $140 This Week?
Solana has experienced a downward trend over the past week, with its value consistently falling. Solana’s trading range was between $122 and $140. SOL’s struggle to find upward traction reflects investors’ broader sense of pessimism. Over the last seven days, the cryptocurrency has shed over 7% of its value.
Over the past month, SOL’s price has decreased by more than 16%, reflecting significant volatility in the cryptocurrency market. Solana has recently demonstrated impressive resilience against downward market trends. The digital currency swiftly recovered after enduring notable drops near the $122 support mark.
Within just two days, Solana saw a significant increase, indicating that positive market sentiment persists. However, there has been a minor correction in the last few hours.
Solana’s Growth in Total Value Locked
According to DeFiLlama, the Solana blockchain’s total value locked (TVL) has reached $4.25 billion. This figure highlights Solana’s growing popularity and adoption in the decentralized finance (DeFi) ecosystem.
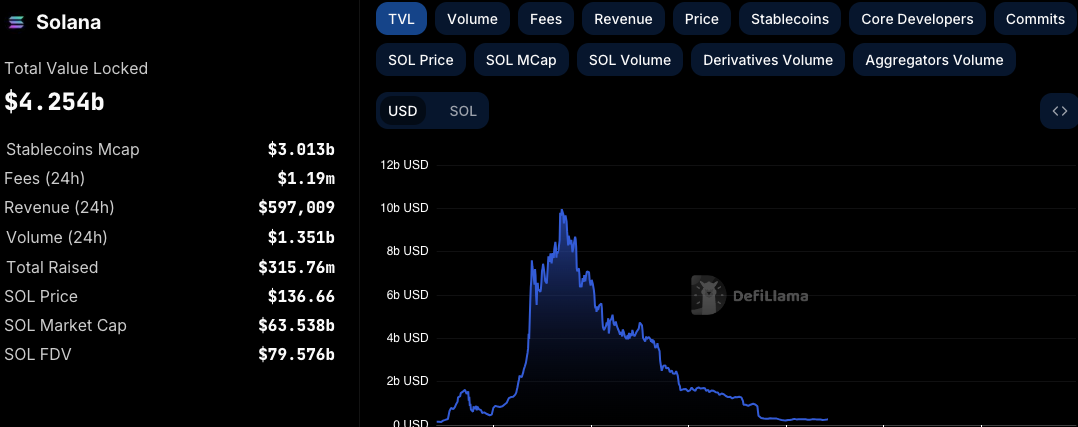
Solana’s 24-hour metrics also reveal substantial activity with $1.19 million in fees generated and a trading volume of $1.351 billion. The platform’s total revenue over the same period stood at $597,009.
Solana’s robust performance is further evidenced by its successful fundraising, which has amassed $315.76 million to date, underscoring investor confidence in its technology and prospects.
With the current consolidation, Solana’s price could surpass the $140 barrier, signaling renewed bullish activity. This could propel the cryptocurrency towards a $170 target. Should this upward momentum continue, Solana might soon test the $200 resistance mark.
Conversely, increased bearish pressures could see Solana retreat to the $130 support level. A continued seller dominance could push the price further down to the $120 zone, indicating a possible bearish shift in the market.
Technical Indicators For SOL
The 24-hour technical indicators for Solana show mixed signals. The Relative Strength Index (RSI) stands at 40.56, suggesting that the cryptocurrency is neither overbought nor oversold, maintaining a neutral position.
The 50-Exponential moving average is above the 20-EMA, indicating a potential shift in market sentiment toward a more cautious outlook.
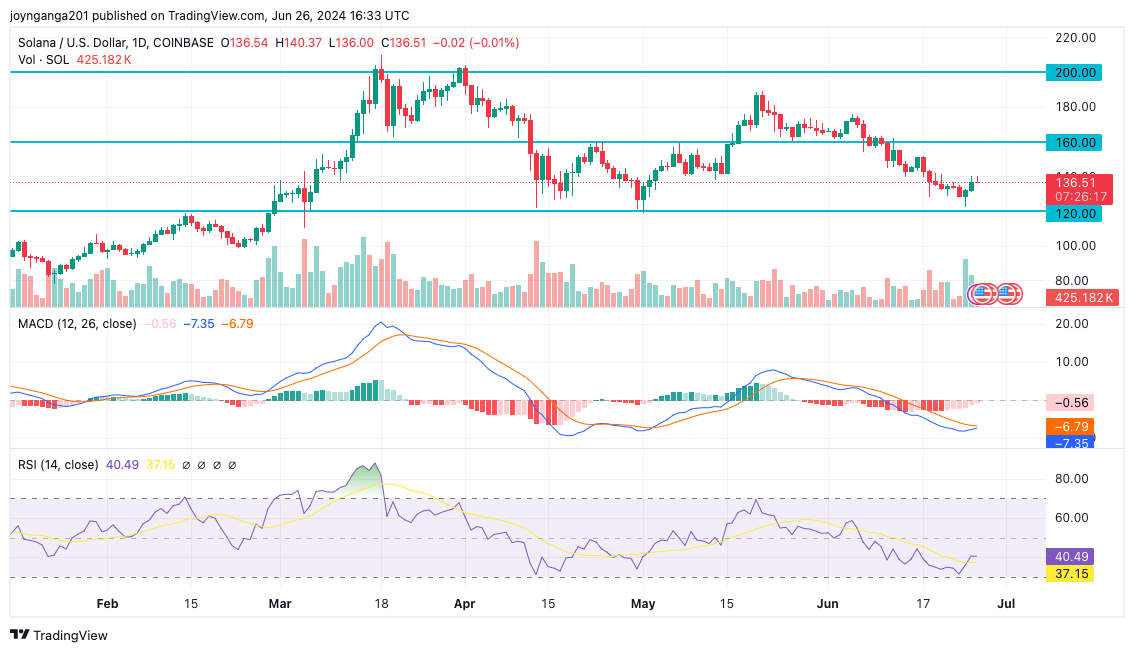
The Moving Average Convergence Divergence (MACD) indicator suggests a continuing bearish sentiment. The MACD line is below the signal line, suggesting that bearish momentum will likely continue.
Read More
- Brett Price Plunges 7% Despite Market Volatility as Analyst Predicts Breakout Potential
- Solana Price Prediction 2024 – 2040
- DePIN Crypto Projects to Watch In 2024 – Top 10 DePIN Coins
- Best Metaverse Coins to Invest – Next Metaverse Coins

Advertisement


