Solana Price Drops 3% as Volume and Open Interest Decline – Can Bulls Rebound Above $163 Mark?

Cryptocurrency trading is speculative and your capital is at risk when you trade. We may earn affiliate commissions from some of the products on this page - at no extra cost to you.

Highlights:
- Solana’s price plunged 3% to $125, with trading volume plummeting 30%.
- Solana’s derivatives market is steeply declining, with volume and open interest dropping.
- Technical indicators show mixed reactions as Solana bulls target the $163 mark.
Solana’s price has plunged 3% to $125, as the trading volume plummets 30% to $2.26B. The crypto market has notably seen a 2.57% decrease to $2.74 trillion, indicating a drop in interest. A decline in price and volume signals an impending trend reversal in the token, likely a loss of interest from market participants amidst recent developments and macroeconomic factors.
Advertisement

SOL has been down 1% in the past 7 days and 25% in a month. However, Pancake, Berachain, and Kava are the top gainers, while Pi Network, JasmyCoin, and Sui are the top losers. The Solana derivatives market shows a steep decline in activity. Open interest and derivative trading volumes have dropped by 3% and 31%, respectively, per Coinglass. Long traders continue to suffer the biggest blow, with $6.32M longs liquidated in the last 24 hours.
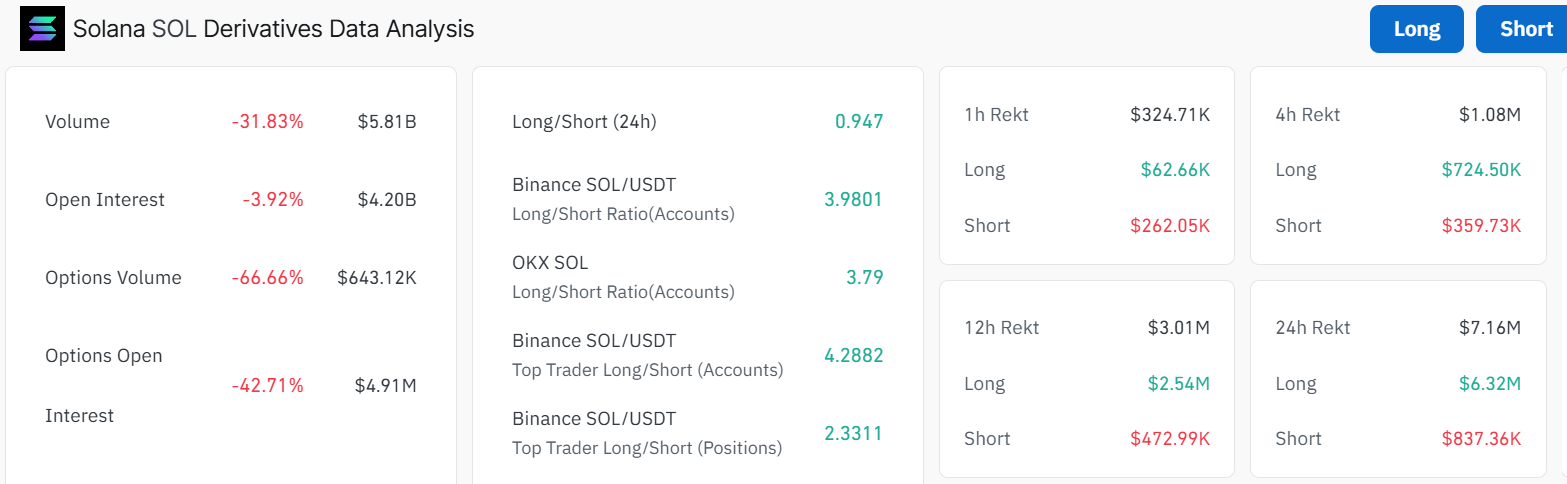
The surging long liquidations have forced the SOL long/short ratio to fall to 0.95, which shows that short traders are now more than long traders in the market. If long traders shy away from opening new positions, it will cause a bearish market outlook that will trigger a Solana price decline.
Solana is testing a crucial support level at $125, down 3% today. If buyers defend this zone, we could see a bounce toward $160-$165. A breakdown below $125 may trigger a further downside. Let’s dive into the technical outlook and decrypt what’s next for the Solana price.
Solana Price Outlook
The SOL/USD daily chart indicates that the price remains within a descending channel, signaling a continuation of the bearish trend. Currently, SOL is trading at $125, slightly consolidating within the channel. The consolidation phase may act as an accumulation period before the bulls spike up in an upward trajectory.
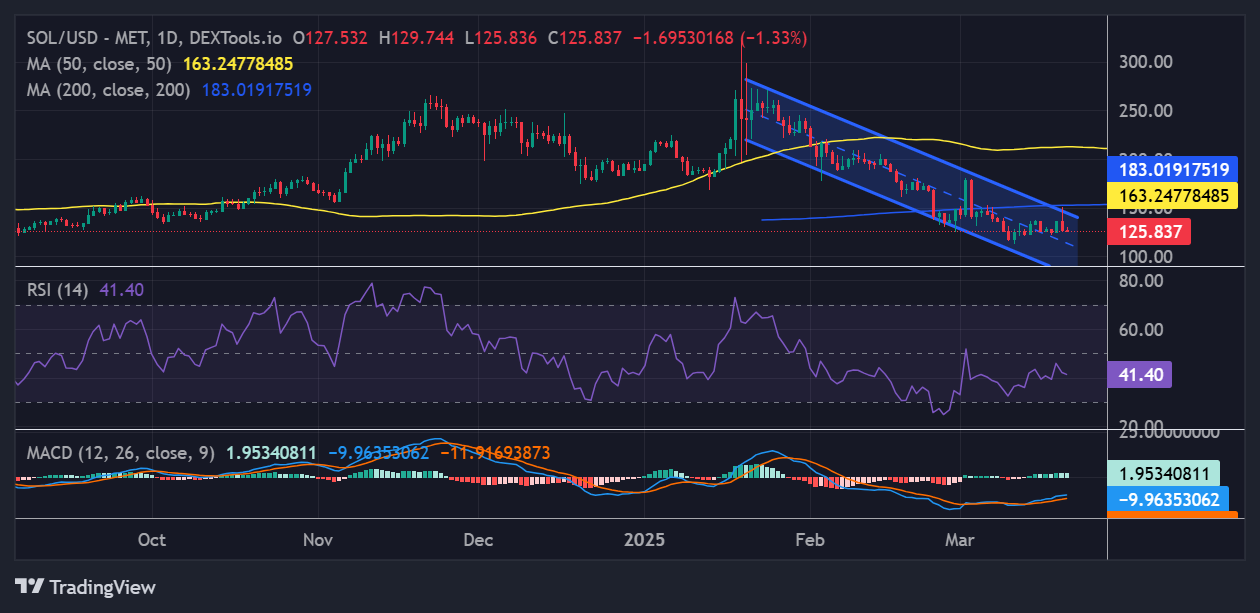
However, the price is still struggling below the 50-day MA ($183.015) and the 200-day MA ($163.24), reinforcing the prevailing bearish sentiment. For a potential shift in momentum, SOL needs to break above these moving averages, which are currently acting as dynamic resistance levels.
SOL May Consolidate Below the Moving Averages
Looking at the daily chart, if the Solana price manages to push above the 50-day and 200-day MAs, bullish momentum could build toward the $240-$260 resistance zone, aligning with the channel’s upper boundary. A successful breakout beyond this level may confirm a trend reversal, potentially driving SOL toward the $299, $320, and $330 resistance levels.
Additionally, the recent drop in trading volume suggests a decrease in market activity, indicating a prevailing bearish sentiment. However, caution is warranted until SOL breaks key resistance levels, as the bearish structure remains intact.
A closer look at the RSI at 41.40 indicates intense selling pressure. However, if investor confidence renews in the market and the RSI pushes to the 48 level, it could ignite intense buying pressure. Notably, the MACD indicator has made a bullish cross-over, calling for traders and investors to buy more SOL.
![]()
eToro Platform
Best Crypto Exchange
- Over 90 top cryptos to trade
- Regulated by top-tier entities
- User-friendly trading app
- 30+ million users
![]()
eToro is a multi-asset investment platform. The value of your investments may go up or down. Your capital is at risk. Don’t invest unless you’re prepared to lose all the money you invest. This is a high-risk investment, and you should not expect to be protected if something goes wrong.
Advertisement


