Solana Price Dips 8% in a Week as Open Interest (OI) Slumps — What’s Next for SOL?


The Solana price is bleeding today, plummeting 2%, with the SOL/USD trading at $144 in the past 24 hours. Despite the plunge, its 24-hour trading volume has soared 23% to $2.33 billion, suggesting increased market activity in the Solana market. SOL is now down 8% in a week; however, the token has risen 10% in a month and 515% in a year.
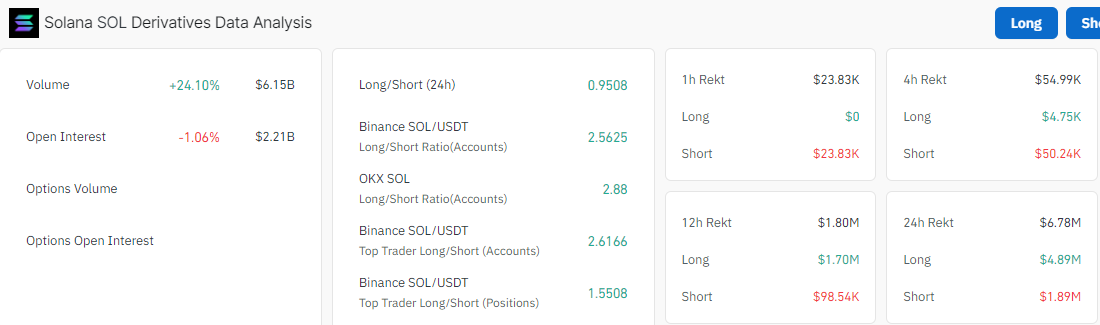
According to Coinglass, a 1.06% slump in Open Interest (OI) to $2.21 billion while the volume increases to $6.15 billion suggests that traders are closing their positions. In other words, there is a potential shift in sentiment or a lack of confidence in Solana’s price direction.
Advertisement

On the other hand, CryptoStonks, a well-known investor, has mentioned that Solana’s price is expected to decrease over the next 40 days. Based on SOL’s price history with significant points and projections, the token may dwindle before a substantial leg up.
Solana's price is expected to decrease over the next 40 days. #SOL pic.twitter.com/ig43NU9Eey
— cryptostonks (@cryptostonks13) October 8, 2024
Solana Statistical Data
Based on CoinmarketCap data:
- SOL price now – $144
- Trading volume (24h) – $2.33 billion
- Market cap – $67 billion
- Total supply – 586 million
- Circulating supply – 469 million
- SOL ranking – #5
As earlier predicted, the Solana price has broken below the ascending channel, with the token exchanging hands at $144. The Solana price initiated a strong leg up from a $132 low, causing the price to jump to the $152 mark.
However, the token encountered resistance at the $152 mark, causing the price to fall like a dead weight in the air, with no strings to keep the bearish sentiments in check. The bulls have, however, established solid support at the $142 mark, cushioning against further losses.
Technical Indicators Flash Bearish as the Bears Dominate the Market
In the meantime, the bulls are portraying some strength that may trigger a market rally. However, resistance at $145 coinciding with the 50-day SMA could invalidate the bulls from a breakout. Hence, bulls must collect as much liquidity as possible before launching the next offensive mission.
Meanwhile, if the $141 support level holds, the bulls could gain momentum, pushing the price to the critical barrier at $145. In the short term, increased buying pressure will surge the price to $157 or above $160.
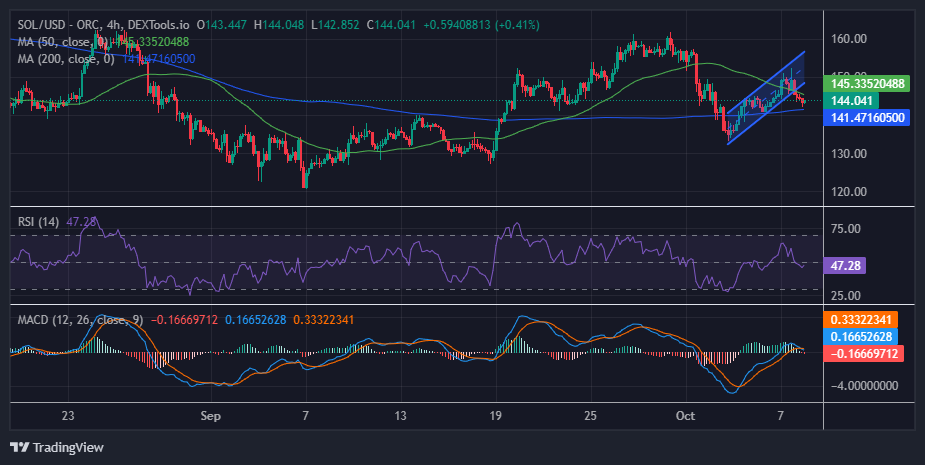
On the other hand, the Relative Strength Index (RSI) adds credibility to the bearish bias as it pushes below the midline region. It sits at 47.28, suggesting intense selling pressure in the Solana market. Moreover, the Soana price is not out of the woods until bulls bring down the confluence resistance created by the 50-day SMA (green).
A sell signal has come into the picture, with the blue MACD line flipping below the orange signal line. As the momentum indicator has changed the trend from the negative region (below the mean line) into the positive area, the bulls might start adding to their positions, resulting in a bullish narrative.
Solana Price Outlook
In the 4-hour chart pattern above, the bears seem to control the market. However, with solid support at $141, coinciding with the 200-day SMA, the bulls might gather strength, propelling the Solana price higher. On the upside, if the bulls gain momentum at this level, they may potentially bring down the technical barrier at the $145 mark. In such a case, the Solana price will resume a meaningful uptrend, rallying to $157 soon.
However, with the bears still dominating the market, increased selling pressure will cause the price to plunge. Moreover, if the Solana bears capitalize on the 50-day SMA, which shows some bearish prospects, they will drive the price to $141. A breach below the $141 support level will trigger panic selling, causing the price to retest the $132 level.
Advertisement


Emmaculate Araka
Emmaculate Araka is a cryptocurrency writer with published works on Crypto2Community and other news sources. She is believer in the transformative power of crypto and the blockchain industry, conducting on-chain analysis, breaking down market-triggering events, and helping traders and investors benefit from expert technical price analysis. Emmaculate finds gratification in diving deep into the crypto space, earning herself significant knowledge and experience. She holds a Bsc. in Information Science, and outside work, Emmaculate loves reading novels and watching documentaries.
View full profile ›ℹ️About Crypto2Community's Editorial Process
Crypto2Community's editorial policy is centered on delivering thoroughly researched, accurate, and unbiased content. We uphold strict editorial policy and sourcing standards, and each page undergoes diligent review by our team of top crypto industry experts and seasoned editors. This process ensures the integrity, relevance, and value of our content for our readers.


