

The Solana (SOL) price is moving bullishly with the rest of the crypto market, led by Bitcoin (BTC). SOL price is up 4% today, with the token trading at $179 during the European trading session. Its trading volume has notably gone ballistic, surging 77% to $3.37 billion in the past 24 hours.
This comes as the potential approval of Solana ETFs rises. Nate Geraci, the president of the ETF store, has predicted that an issuer will file for combined spot BTC, ETH, and SOL ETF in the next few months. These announcements have fueled the crypto market, led by the Solana ecosystem. He said, ‘’ We’re quickly heading down the path towards index-based & actively managed crypto ETFs.’’
Advertisement

Prediction…
An ETF issuer will file for combined spot btc, eth, & sol ETF in next few months.
We’re quickly heading down path towards index-based & actively managed crypto ETFs.
— Nate Geraci (@NateGeraci) July 22, 2024
Moreover, the spot Ethereum ETFs are anticipated to commence trading on 23 July.
Welcome to spot eth ETF *launch* week…
Trading set to begin on Tuesday!
Table courtesy of @JSeyff. pic.twitter.com/BbpQz8TY1J
— Nate Geraci (@NateGeraci) July 21, 2024
Solana Statistical Data
Based on Coinmarketcap data:
- SOL price now – $179
- SOL market cap – $83 billion
- SOL total supply – 580 million
- SOL circulating supply – 464 million
- SOL ranking – #5
SOL Shows a Slight Retrace as Technical Indicators Suggest Overbought
Over the weekend, the Solana price flipped bullishly, recording a new high at $185. Moreover, the token broke out above the rising channels, tilting the odds toward the buyers. Although slightly bullish on the four-hour chart timeframe, the technical outlook reveals an overbought token. Let us dive deep into the technical outlook to see whether the bulls or bears win the struggle.
The Solana price holds well above the crucial bull market indicators, the 50-day and 200-day Simple Moving averages (SMA). In this case, the $144 and $161 levels act as the immediate support keys in the Solana market. This, with no doubt, shows dwindling seller momentum in the Solana price.
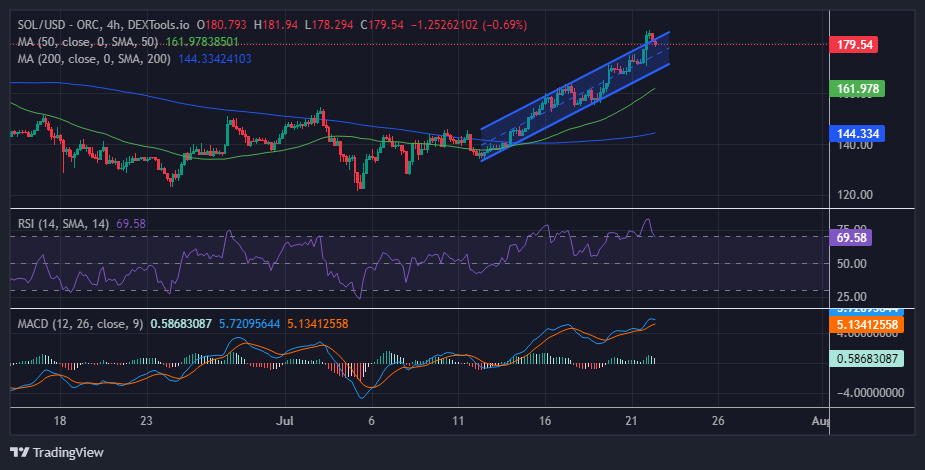
In the same way, the Relative Strength Index (RSI) has its strength at 69. This cautions traders of a potential correction. After climbing from support at the mid-line (50), the RSI jumped into the overbought area, almost hitting an 85-level strength before retreating to 69. Traders won’t have to worry about sudden pullbacks with the RSI above 70, but this position suggests that a correction is imminent.
Moreover, the Moving Average Convergence Divergence (MACD) indicator upholds the bullish picture with a buy signal. However, the Solana price must push above the rising trendline on the four-hour chart to sustain the uptrend. Meanwhile, the momentum indicator teases with a sell signal in the Solana market. This will only be executed if the MACD signal crosses below the signal line (orange band), inclining traders to make selling pressure.
Solana Price Future Outlook
In the 4-hour chart timeframe, the Solana price is facing a retracement after hitting the overbought conditions over the weekend. In other words, SOL is on the cusp of a reversal. The high influx of traders could also put the accrued gains at risk as profit-booking activities escalate.
In such a scenario, immediate support at $171 would be anticipated, but investors should start adjusting to a more extended correction if declines intensify and overwhelm the bulls. Meanwhile, the 50-day SMA currently holds at $161, and the 200-day SMA holds at $144, which is in line to help absorb the selling pressure.
Conversely, if the bulls gather courage at this level, they might push the SOL price above the $185 resistance, targeting the $200 mark in a few days.
Learn More
- Next Cryptocurrency to Explode in July 2024
- Crypto Price Predictions
- Best Solana Meme Coins to Buy In 2024
- Joe Biden Drops Out of Presidential Race, Biden-Linked Memecoins Plunge 60%
- Spot Bitcoin ETFs Draw $17B in Net Inflows Since Launch, Now Hold Over 900,000 BTC
- XRP Surges as New SEC Meeting Date Sparks Ripple Settlement Speculation
- Is It Too Late To Buy JUP? Jupiter Price Soars 8% As The Bulls Target $1

Advertisement


