Solana Price Analysis: SOL Slumbs 3%, What Next for the Altcoin?

Cryptocurrency trading is speculative and your capital is at risk when you trade. We may earn affiliate commissions from some of the products on this page - at no extra cost to you.

The Solana (SOL) price prediction is in focus as the $172 support level breaks, raising concerns about potential further selling. Over the past 24 hours, the Solana price has decreased by 3%, with the SOL/USD trading at $163. This represents an 8% loss in a week but a 10% gain in a month. The altcoin has also risen by 596% in a year, outperforming most rival cryptocurrencies. Despite the sharp price decline, its trading volume has pumped 17% to $4.17 billion, indicating confidence among traders and investors.
Meanwhile, Fed Chair Jerome Powell has suggested that a rate cut is coming in September, which will likely cause the Solana price to rebound in the coming days.
Advertisement

Fed Chair Jerome Powell Hints at Possible Interest Rate Cut in September – Dailymotion https://t.co/HAv5bY0CK7
— FOMC Alerts (@FOMCAlerts) August 1, 2024
According to the Reuters report, the FOMC met and decided to keep rates in the 5%- 5.25% range. This has caused dismay among many traders and investors, as Jerome Powell had noted that positive economic data would lead to reduced rates in September.
July 2024 Fed Meeting: Rates Remain Steady For Another Month | J.P. Morgan https://t.co/xHDJWzphST
— FOMC Alerts (@FOMCAlerts) August 2, 2024
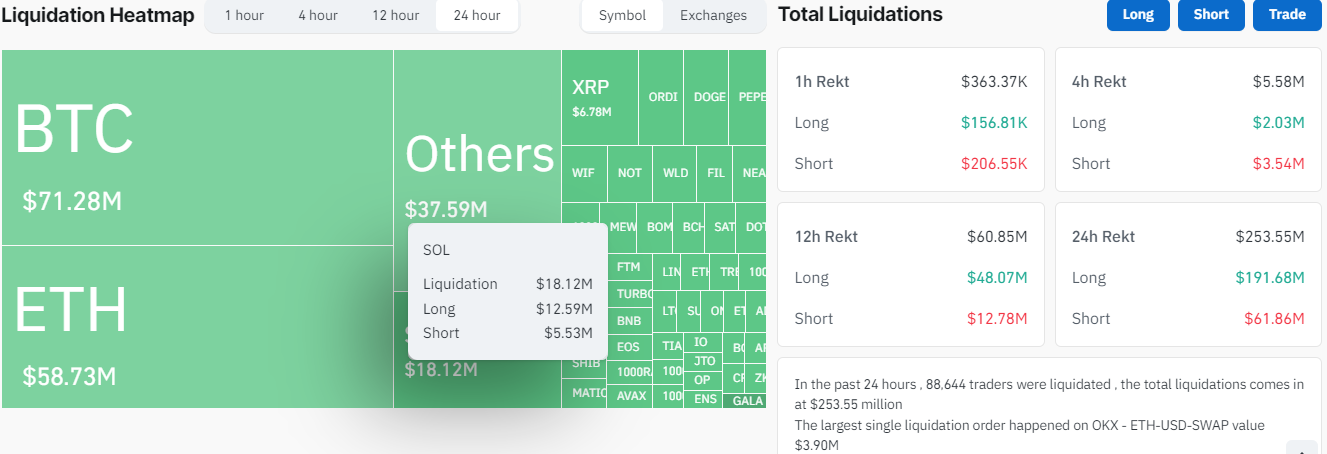
Meanwhile, data from Coinglass shows over 250 million crypto liquidations in the past 24 hours. This includes $5.53 million short SOL positions and $12.59 million long liquidations.
On the other hand, the leading cryptocurrencies, Bitcoin and Ethereum, are leading the broader crypto market downward. At press time, the king of crypto (BTC) and ETH are down almost 1%, trading at $64,700 and $3,158, respectively.
Solana Statistical Data
Based on Coinmarketcap data:
- SOL price now – $0.1205
- SOL market cap – $17.53 billion
- SOL total supply – 145.35 billion
- SOL circulating supply – 145.35 billion
- SOL ranking – #8
Solana Price Crashes: Is a Rebound Possible?
The Solana price started pulling back after hitting resistance at around $187, forming a double-bottom pattern. This has led to the SOL price losing its critical support at $172, currently trading at $163, with the bears dominating the market. Moreover, if the support at $152 won’t hold, the SOL price will likely follow the overall market trend downwards.
Diving into the technical outlook, the SOL price trades well above the 50-day and 200-day Simple Moving Averages(SAMs). The $152 and $ 145 act as immediate support keys for the bulls to attempt a recovery.
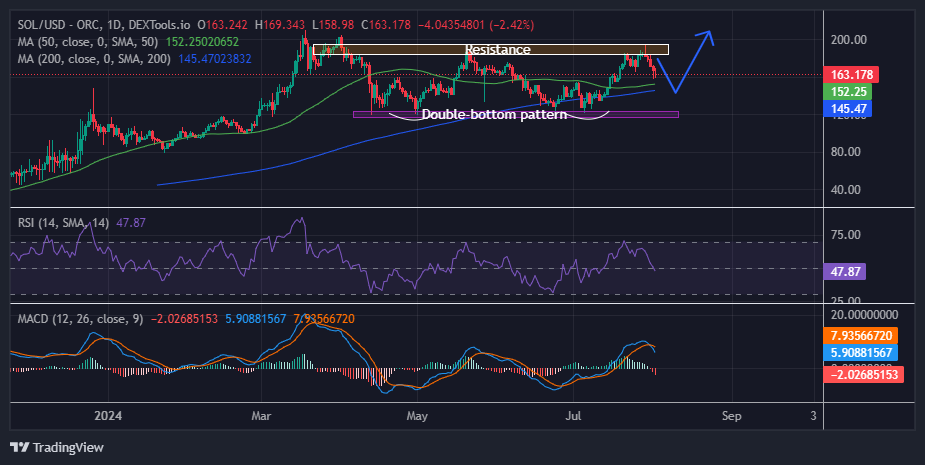
Moreover, the Relative Strength Index (RSI) is below the 50 mean level, currently at 47. If selling pressure mounts, the RSI could hurtle toward the 30-oversold zone as the momentum indicator points south. In the same way, the Moving Average Convergence Divergence (MACD) has flipped bearishly. The MACD indicator has crossed below the signal line (orange band). This reinforces the SOL market outlook, accentuating the sell signal.
Will the SOL Bulls Attempt a Rally Towards the $200 Mark?
The bears have the upper hand in the one-day chart analysis, as technical indicators support the outlook. With the formation of a double-bottom pattern, more downside is expected before a strong move upwards. In such a case, the bears may drive the SOL price south to around $145 support level.
Conversely, if the bulls show resilience at this level, the SOL price could surge to a new high this month. If the buyers regain control, they might use the $152 support level, potentially propelling the SOL price past the $187 technical barrier. The bulls could hit the $210 mark this month in a highly bullish case.
Learn More
- Next Cryptocurrency to Explode in August 2024
- Ethena Price Prediction 2024 – 2040
- Next 100x Crypto – 12 Promising Coins with Power to 100x
- Ondo Price Prediction: ONDO Faces Correction to $0.72 as Key Support Broken

Advertisement


