PEPE Price Weakens Despite 1% Gain, Analysts Warn of 10-15% Drop

Cryptocurrency trading is speculative and your capital is at risk when you trade. We may earn affiliate commissions from some of the products on this page - at no extra cost to you.

Highlights:
- PEPE has hit a critical support point, with a potential 10-15% drop if it fails to hold.
- A double bottom pattern forms between $0.00000950 and $0.00000960, signalling a rebound area.
- The rising RSI suggests a possible bullish reversal if it crosses 50, targeting the $0.00001000 resistance.
The Pepe price has jumped 1% in the last 24 hours to trade at $0.000009634 as of 4 a.m. EST on a 13% surge in trading volume to $1.05 billion. Now, the market capitalization stands at $4 billion.
Advertisement

According to crypto analyst PS Trade on X (formerly known as Twitter), the price of PEPE/USDT has reached a “local critical point,” indicating a key technical level that could play a pivotal role in determining the market’s direction. This critical point represents an area of potential support or resistance where the price movement could either stabilize or shift significantly.
$PEPE
The PEPE price has now stopped at a local critical point. After the local update of the lows of October 17, the price of #PEPEUSDT did not fall. Buyers are now unable to realize at least a small rebound in the price. Therefore, the probability of a 10-15% drop in the PEPE… pic.twitter.com/e3aeCXPSyw— PS trade (@PStrade2) October 24, 2024
PEPE Faces Key Support Test as Analysts Warn of Bearish Momentum
PS Trade also notes that while the local low was reached on October 17, the price did not break down afterward. That would mean it found some supportive level, but at the same time, there is no strong buying to drive the price upwards. The fact that buyers cannot take advantage of this level already indicates weak buying pressure, which could mean caution or a lack of confidence in investors.
The analyst warns that the price of the PEPE might drop 10-15%, cautioning that an inability to hold at this support level might lead to additional bearish momentum. This drop would mean that the bears are still dominant, and the correction might get deeper.
Below is the chart of these observations: the key support level is colored in green, and one key area of past accumulation is colored in purple. This suggests that if the price were to break below this area, the likelihood of further downside could increase.
PEPE Statistics
- Pepe price: $0.000009634
- Market capitalization: $4 billion
- Trading Volume:$ 1.05 billion
- Circulating supply: 420.69 trillion
- Total supply: 420.69 trillion
Pepe Price Rebounds on Double Bottom Pattern
The PEPE/USDT chart on Binance, in the 30-minute timeframe, shows the price currently at 0.00000964, with key technical indicators suggesting a possible bullish reversal. A major support zone is visible between 0.00000950 and 0.00000960, where the price has bounced twice, forming a double support pattern. This area is crucial, as it may prevent further declines, and the price has already started to rebound from it.
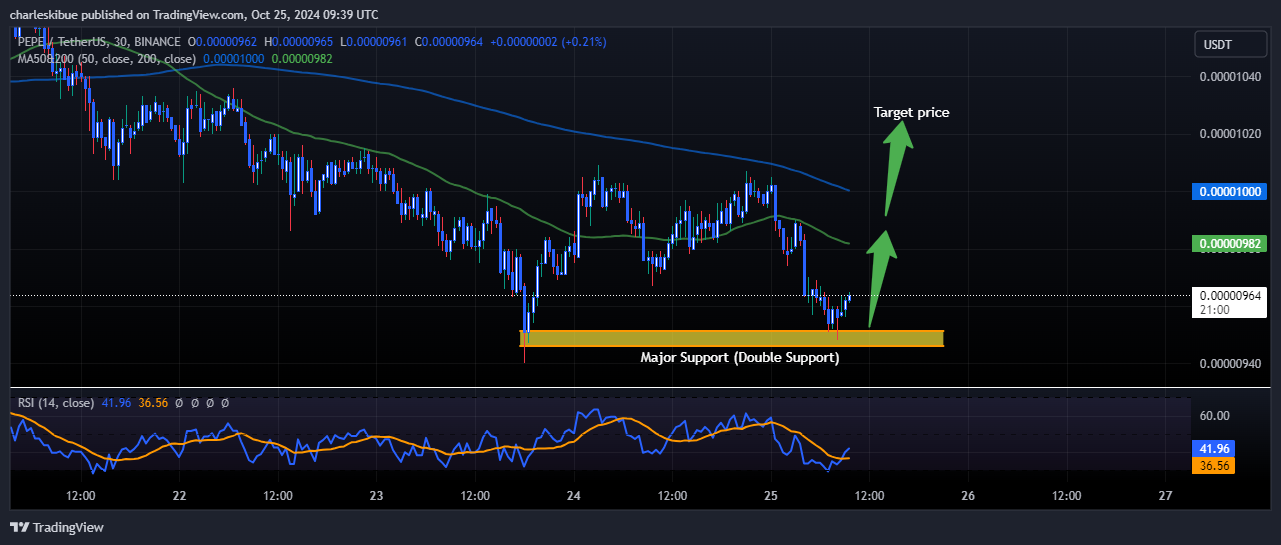
The chart also displays the 50-period moving average (around 0.00000982) and the 200-period moving average (at 0.00001000). The 50-period moving average is currently below the 200-period, indicating an overall bearish trend. Still, the price seems to be aiming toward breaking through the 50-MA and potentially reaching the 0.00001000 level, which is marked as the target price and aligns with the 200-MA. This level could act as resistance in the short term.
The RSI (14-period) is at 41.96, slightly below the neutral 50 level, suggesting that while the market is still bearish, momentum may be shifting upward. The RSI is rising from its recent low of 36.56, signaling a potential bullish reversal if it crosses above 50.
In conclusion, if the price maintains its current support and breaks through the 0.00000982 resistance, it may move toward the 0.00001000 target. However, if it fails to hold the support zone, there is a risk of further downside, with the next potential support below 0.00000940.
Advertisement


