


The Pepe price has surged 4% in the past 24 hours to trade at $0.000009631 as of 3:30 a.m. EST, on a 69% surge in trading volume to $1.5 billion. Investors celebrated as PEPE jumped by 86.56% in 7 days after the Spot BTC ETF approval. A similar reaction is expected with the start of Spot Ethereum ETFs trading, especially since Ethereum is closely linked to PEPE.
Today marks the start of #Ethereum Spot ETFs trading in the US! 🔥
Advertisement
This is a huge milestone for $ETH and the whole #crypto market. Are you excited? pic.twitter.com/yYoLUG0NPP
— Wirex (@wirexapp) July 23, 2024

Currently, PEPE is stabilizing after breaking out from its bullish flag pattern. This consolidation often suggests that a continued bullish trend could be coming. The $0.0000015 level is strong support, as PEPE has bounced off this level several times, suggesting it could lead to a potential bullish rally.
Approving Spot Ethereum ETFs in the United States is a big milestone. This is expected to boost institutional interest in Ethereum and affect the market values of memecoins like PEPE. However, IntoTheBlock data shows a drop in large transactions from 179 to 129 over the past week, with a 27.93% decrease in the last 24 hours. Such a drop may precede significant price movement.
Additionally, Coinglass liquidity data indicated a balanced market with bulls having slight leverage, suggesting investors anticipate a short-term price hike for PEPE.
PEPE Price Statistics
- Pepe price: $0.00001218
- Market Cap: $5.12Billion
- Trading Volume: $1.57Billion
- Circulating Supply: 420.69Trillion
- Total Supply: 420.69Trillion
Pepe Price Bullish Pennant Signals a Bull Rally Ahead
The Pepe price signals a possible recovery above the bearish channel, suggesting that Pepe’s positive trend might continue. The price indicates a bounce back from the channel’s lower trendline, creating a solid support zone at $0.00000863 and helping the bulls start a rally. Determined bulls drive this upward movement, aiming to push the price above the channel’s upper trendline and trigger a bull run.
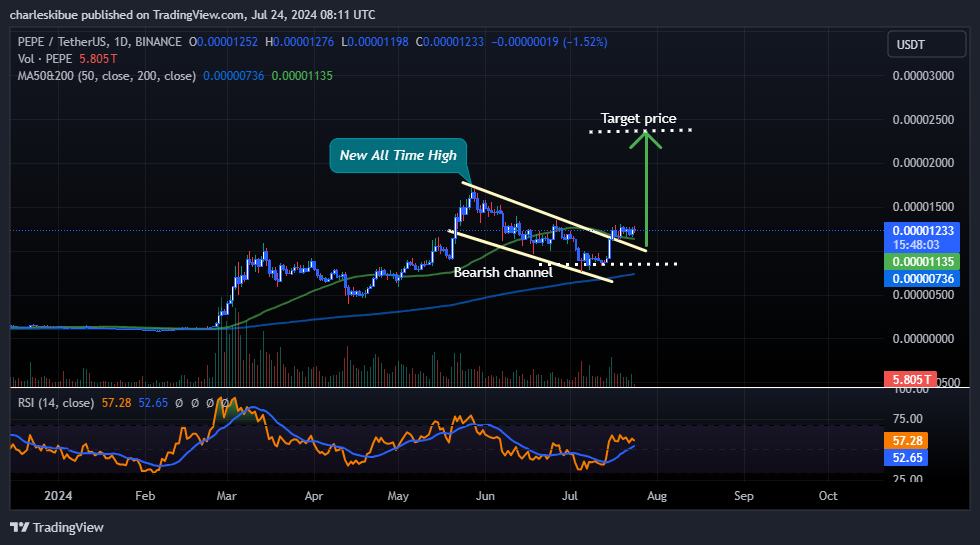
Currently, the price is trading around the 50 simple moving average (SMA) and staying above the 200 SMA, indicating a potential bullish rally. This uptrend is particularly strong near the 50 SMA, showing increased buyer interest and growing market optimism.
The MACD (Moving Average Convergence Divergence) is also positive, with the blue line recently crossing above the orange signal line. This crossover and the positive histogram, which shows the difference between the MACD and its signal line, reflect a bullish market sentiment.
Additionally, the Relative Strength Index (RSI) has bounced back from 40 and climbed to 50, suggesting strong buying momentum. This rise in the RSI points to increased buying activity, and it could soon reach overbought territory, indicating more market enthusiasm and a continued upward price trend.
Pepe Price Bulls Poised to Reclaim Its All-Time High
The bearish channel pattern suggests that the upward trend could continue, pushing the price to even greater heights. If the price breaks above the channel’s upper trendline, it could empower buyers to challenge the resistance level set by the previous all-time high of $0.00001719, with an ambitious target of reaching a new peak at $0.00002025.
Conversely, if sellers take control of the market, we might see a downtrend below the channel. In this scenario, the price might drop to approximately $0.00000570, indicating a temporary pullback before a possible bullish rebound.
Advertisement


