


The Pepe price has surged 2.5% in the last 24 hours to trade at $0.000007929 as of 5 a.m. EST on a 2.8% drop in trading volume to $734 million. Pepe Coin price has lagged behind that of other leading cryptocurrencies, reflecting a market split between bearish traders and bullish long-term investors.
Despite securing a free listing on the upcoming Hong Kong-based HashKey exchange, Pepe is facing strong resistance. A tug-of-war between large holders and retail traders drives Pepe Coin’s current price stagnation. While whales are accumulating PEPE in anticipation of a price increase, retail traders appear bearish, as indicated by data from Coinglass.
Advertisement

$PEPE Update… my first update since back from vacation… been some nasty price action – that Aug 5th Monday morning crash straight off the plane was unpleasant to say the least… this last 4hr candle is the first I have seen where I think price could hold… candles before it… pic.twitter.com/PnJXpaWVSP
— Trader685 (@Trader685) August 21, 2024
The PEPE Crypto Derivatives Visualizer reveals that traders have been closing their Short positions in profit, evidenced by a drop in open interest (OI) as the price rose. Typically, closing Shorts would lead to the opening of Long positions, but a second metric suggests this may not be happening as expected.
PEPE Statistics
- Pepe price: $0.000007929
- Market Cap: $3.3 Billion
- Trading volume: $734 million
- Circulating supply: 420 trillion
- Total supply: 420 trillion
Pepe Price Analysis-Potential Bullish Reversal Within the Falling Wedge
The PEPE/USD pair highlights key technical signals that suggest potential future price movements. A key feature of the chart is the falling wedge pattern, characterized by progressively lower highs and lows within a narrowing channel that is seen as a bullish reversal signal.
While the price has been trending downward, there’s a growing possibility of a reversal to the upside. As the wedge’s upper and lower trendlines converge, the price is nearing a critical point where it could break out above the wedge, signaling a potential shift from a bearish to a bullish trend.
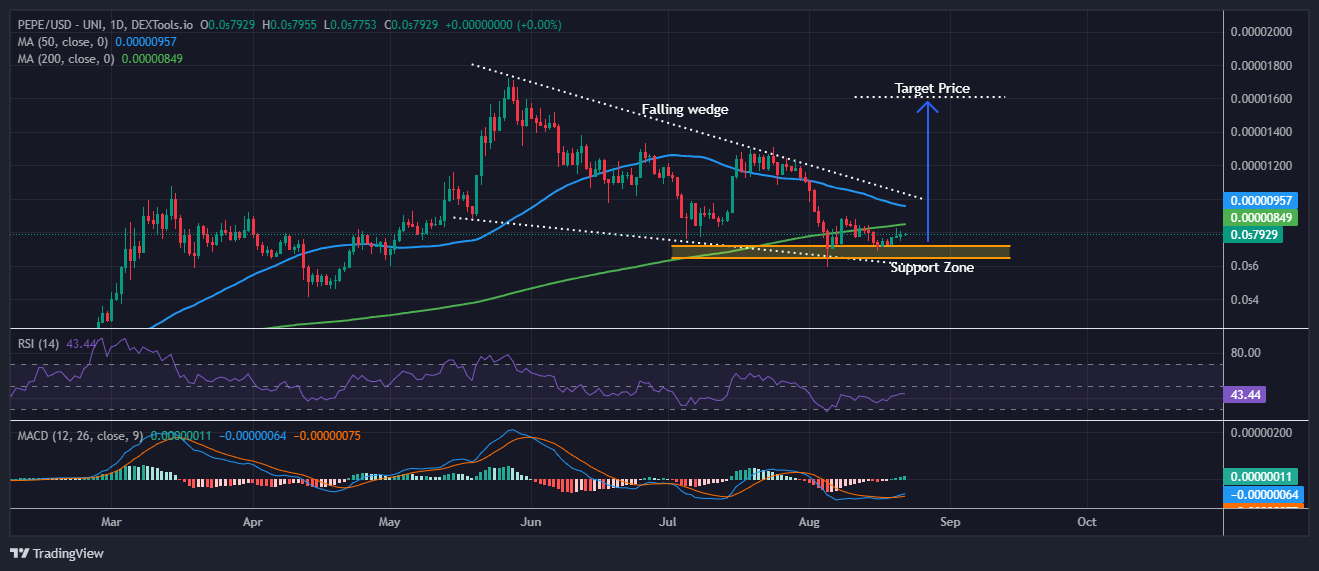
There is also a significant support zone where the price has consistently found a base, preventing further decline. This zone is crucial, as it indicates strong buying interest that could drive the price higher. If a breakout from the falling wedge occurs, this support zone could serve as a launchpad for the price to move toward the indicated target level, which is significantly above the current price.
The 50-day (blue line) and 200-day (green line) moving averages. Currently, the price is below the 50-day moving average, indicating a short-term bearish trend. However, the price is close to the 200-day moving average, a key long-term support level. If the price manages to break above the 50-day moving average, it could indicate the beginning of a bullish trend.
Pepe Price Technical Indicators Signal Potential Reversal
The Relative Strength Index (RSI) is at 43.28, placing it in neutral territory. This suggests the asset is neither overbought nor oversold, leaving room for potential upward movement if market sentiment improves.
The Moving Average Convergence Divergence (MACD) shows slight bearish momentum, with the MACD line just below the signal line, both in negative territory. This suggests that while the downward momentum persists, it may be weakening. A bullish crossover of the MACD line above the signal line could confirm an upward move.
The PEPE/USD pair could be nearing a pivotal moment. The falling wedge pattern, combined with the support zone and proximity to the 200-day moving average, suggests a possible bullish reversal, pushing the price to $0.00001608. However, the RSI and MACD indicators do not yet fully support this outlook, so it’s prudent to wait for confirmation of a breakout. If the price breaks above the wedge and the 50-day moving average, it could aim for a higher target level.
Advertisement


