Pepe Price Skyrockets 24% as the Bulls Target 0.00001247 Mark Amidst Market Recovery

Cryptocurrency trading is speculative and your capital is at risk when you trade. We may earn affiliate commissions from some of the products on this page - at no extra cost to you.

Pepe price (PEPE) is moving bullishly in tandem with the rest of the crypto market, led by Bitcoin (BTC) and Ethereum (ETH). The positive market-wide outlook has increased the total capitalization by 5.28% to around $1.94 trillion. PEPE is trading at 0.000007765, a 24% surge in the last 24 hours. The noticeable price movement is accompanied by a rise in its 24-hour trading volume, which has skyrocketed 5% to $1.93 billion.
With the pioneering cryptocurrency Bitcoin (BTC) dominance rising to 60%, it suggests it makes up most of the cryptocurrency market. Often, cryptocurrencies and meme coins ride with the wave of Bitcoin. As a result, if Bitcoin stays bullish, the frog-themed meme coin might trim a zero from its declines.
Advertisement

$PEPE is gaining strength on the charts, gearing up for another upside move. If Bitcoin stays bullish, this memecoin might just trim a zero from its price. $SHIB and $DOGE are leading the charge.
Previously there was an 11x surge in profits. #memecoins pic.twitter.com/ELoIwjzTRE— Decilizer (@decilizer) August 6, 2024
Pepe Statistical Data
Based on CoinmarketCap data:
- PEPE price now – $0.000007765
- PEPE market cap – $3.27 billion
- PEPE total supply – 420.69 trillion
- PEPE circulating supply – 420.69 trillion
- PEPE ranking – #25
Pepe Price About to Trigger a Bullish Reversal
The bullish outlook in the crypto market, coupled with the move out of the red zone, with support at $0.000007725 and resistance at $0.00001041, promises a more significant breakout to $0.0000124. Yesterday, Pepe’s price dropped to as low as $0.000005955. However, a bullish reversal is in check if the buyers play their cards well.
The 50-day (green) and 200-day (blue) Simple Moving Averages(SMAs) formed a death cross at around $0.00001054. This led to the sellers capitalizing on the death cross, dwindling the price to a low of $0.000005955. However, the bulls are showing resilience, but they must first deal with the $0.000009757 and $0.00001041 resistance keys.
Meanwhile, the PEPE price holds above key bullish indicators on the four-hour chart timeframe. To start with, the Relative Strength Index has rebounded from the oversold levels, currently at 43. There is more room for the bulls to move upward, as increased buying pressure above the mean level of 50 would invalidate the bearish outlook. This could push the Pepe price further north.
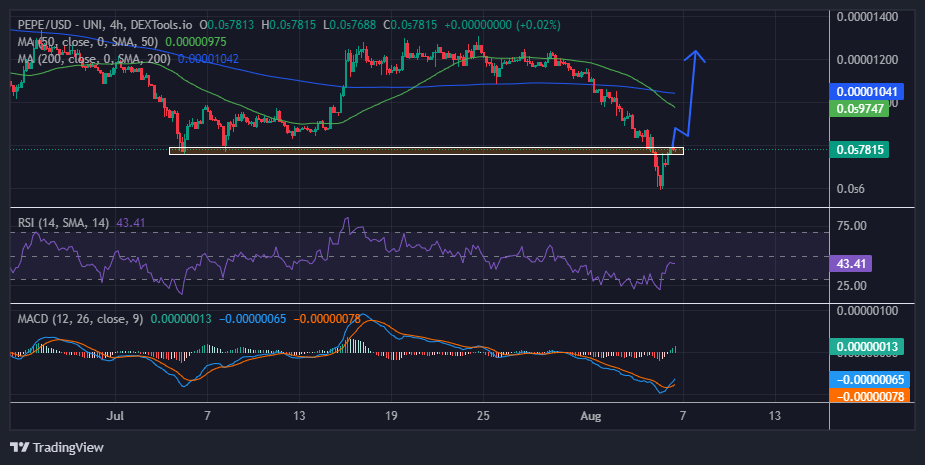
The Moving Average Convergence Divergence (MACD) indicator upholds the bullish picture with a buy signal outlook. This call to traders to consider buying PEPE manifested with the MACD line in blue, crossing above the orange signal line. As the momentum indicator gradually ascends above the mean line (0.00) into the positive region, the path with the least resistance stays on the upside.
Will the PEPE Bulls Sustain the Momentum?
According to the 4-hour chart analysis, the bulls have entered the market and could trigger a bullish reversal. A flip of the $0.000009747 resistance level into a support floor would pave the way for further upside. A break and close above it would encourage more buy orders, potentially sending the frog-themed memecoin to the range high of $0.00001247. The gains could extrapolate towards a new peak in a highly bullish case.
Conversely, the PEPE price could fall if the $0.000007725 support level breaks. In such a directional bias, only a break and close below $0.000007114 would spook investors. In a dire case where the memecoins slide lower, a candlestick close below $0.000005955, last tested on August 5, would validate the bearish sentiment.
Learn More
- Next Cryptocurrency to Explode in August 2024
- Toncoin Price Prediction 2024 – 2040
- Next 100x Crypto – 12 Promising Coins with Power to 100x
- Binance CEO Links Market Crash to Macroeconomic Factors
- Ethereum Price Dips 20% as Bearish Signals Prevail: What Next for ETH?
- ONDO Price Prediction: Selloff Could See ONDO Drop Below $0.50 in the Short Term

Advertisement


