Pepe Price Forecast: Is the Meme Coin Poised for a Recovery Beyond $0.00001?

Cryptocurrency trading is speculative and your capital is at risk when you trade. We may earn affiliate commissions from some of the products on this page - at no extra cost to you.

Pepe, a popular meme coin, has seen notable fluctuations in the past 24 hours. Pepe is trading at $0.00000914, with a slight 0.28% increase during the European trading session. The trading volume for Pepe has experienced a significant decrease, dropping by 29.79% to reach $675.08 million over the last day.
Despite these changes, Pepe maintains a robust market capitalization of approximately $3.84 billion, ranking it 24th in the market cap listings.
Advertisement

What’s Next for the Pepe Price?
Over the past week, Pepe coin has been trading in a highly volatile market, demonstrating significant fluctuations in its value. PEPE has experienced a notable decrease of 10.69% over the last seven days. The price chart indicates a range between a low of $0.000008791 and a high of $0.000009427 during this period.
Notably, the Pepe coin reached its all-time high of $0.00001718 a month ago, and since then, the value has declined by 46.57%, showcasing downward trends. Over the past month, PEPE has seen a decrease of 26% after a crypto market sell-off. However, with the current market recovery, investors have renewed optimism.
Most of the cryptocurrencies are recovering from their recent lows, showing signs of resilience in a volatile market. Bitcoin has reclaimed a significant support level, currently stabilizing around $57,000. Similarly, Ethereum has shown a strong rebound, surging past $3,100, fueling other altcoins.
Impact of Whale Transactions
Whale Alert has reported a major market transaction involving 9 trillion PEPE tokens, worth approximately $82 million, transferred to Bybit from an unknown wallet at 04:06:35 UTC on July 10, 2024. This transaction coincided with a 9.7% increase in PEPE’s market price over the past week.
The transaction has sparked considerable speculation and analysis within the trading community. The sender’s wallet, known for its high transaction frequency and diversification across multiple cryptocurrencies, has been particularly active.
🚨 🚨 🚨 🚨 9,000,000,000,000 #PEPE (82,170,000 USD) transferred from unknown wallet to #Bybithttps://t.co/vpbrzjmnX6
— Whale Alert (@whale_alert) July 10, 2024
Recent substantial transfers from this wallet to Bybit’s hot wallet have included significant amounts of ETH and various tokens. This activity suggests a strategy possibly focused on liquidity management or preparing for market movements.
Price Projections and Future Outlook
The meme coin, PEPE, is currently experiencing fluctuations in its market value. If positive momentum gains traction, PEPE could rebound to $0.00001, a previous resistance point. Stabilization here might lead to an increase to $0.000015. If bullish forces strengthen further, surpassing the $0.00002 mark could pave the way for a rally to higher levels.
Conversely, if bearish trends exert pressure on the meme coin, it might fall to the support level of $0.000009. A further decline to $0.000008 is also possible, indicating a sustained bearish outlook. If bearish momentum continues, PEPE’s price could drop to a low of $0.000007. The 4-hour chart for PEPE shows the sideways trend. The Relative Strength Index (RSI)stands at about 50.15. This level is typically considered neutral, suggesting neither overbought nor oversold conditions.
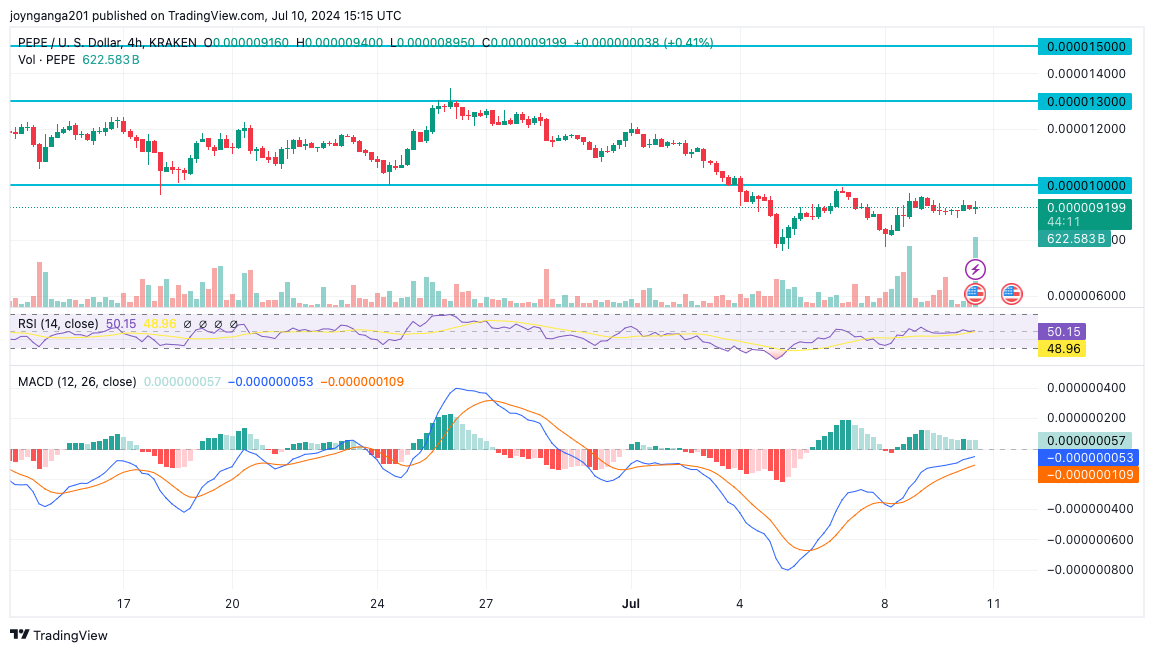
The Moving Average Convergence Divergence (MACD) shows a slight convergence between the MACD line and the signal line, indicating a potential change in momentum. The histogram also appears to be shifting closer to the zero line, further supporting this potential shift.
Read More
- Bitwise Faces Lawsuit Over Fraud Allegations, Investors Seeks 2M for Damages
- Bitcoin Price Soars 2% as K33 Research Warns of a Plunge Toward the $50,000 Range
- Chamber of Progress Urges Biden to Support Crypto Amid 2024 Election
- Bitcoin Price Bounces Back To $57,000 Mark, As The Bulls Are Poised For An Upward Trajectory
- DigitalX to Launch Bitcoin ETF on Australia’s ASX
- HTX Ventures Invests in Lombard’s Bitcoin Restaking Ecosystem

Advertisement


