Litecoin Price Drops 4% as the Bearish Grip Strengthens Risking Further Downside

Cryptocurrency trading is speculative and your capital is at risk when you trade. We may earn affiliate commissions from some of the products on this page - at no extra cost to you.

Highlights:
- Litecoin price drops 4% to $75 as bulls fail to hold above the resistance zone.
- Santiment data indicate that dormant wallets are becoming active, which may intensify selling pressure.
- The technical outlook indicates a potential downside to $72 for the LTC price.
Litecoin (LTC) price is in the red, down 4% to exchange hands at $75 as the bulls fail to overcome the key resistance zone. The bearish mood is reinforced by increased activity in dormant wallets. Meanwhile, technical analysis indicates further downside, with momentum indicators turning bearish.
Advertisement

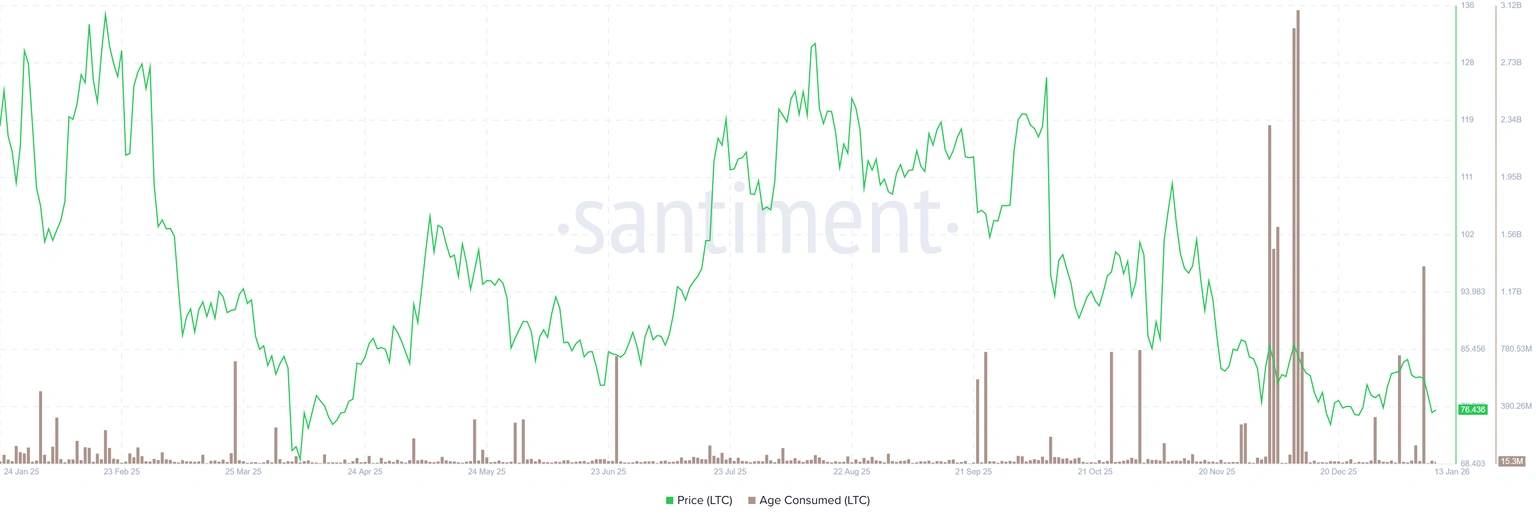
According to the age-consumed index from Santiment, as shown below, it indicates bearish signals. The spikes on this index indicate that dormant tokens (stored tokens) are moving, and it can be used to identify short-term local tops or bottoms. As in the case of Litecoin, the historical record indicates that a downward trend began when LTC price spikes were followed by transfers to wallets or exchanges. This has hence added to the selling pressure in the LTC market.
On the other hand, Litecoin’s long-to-short ratio is 0.8392, according to Coinglass data. This ratio is below 1, indicating bearish sentiment, as more traders are betting on the asset’s price to decline.
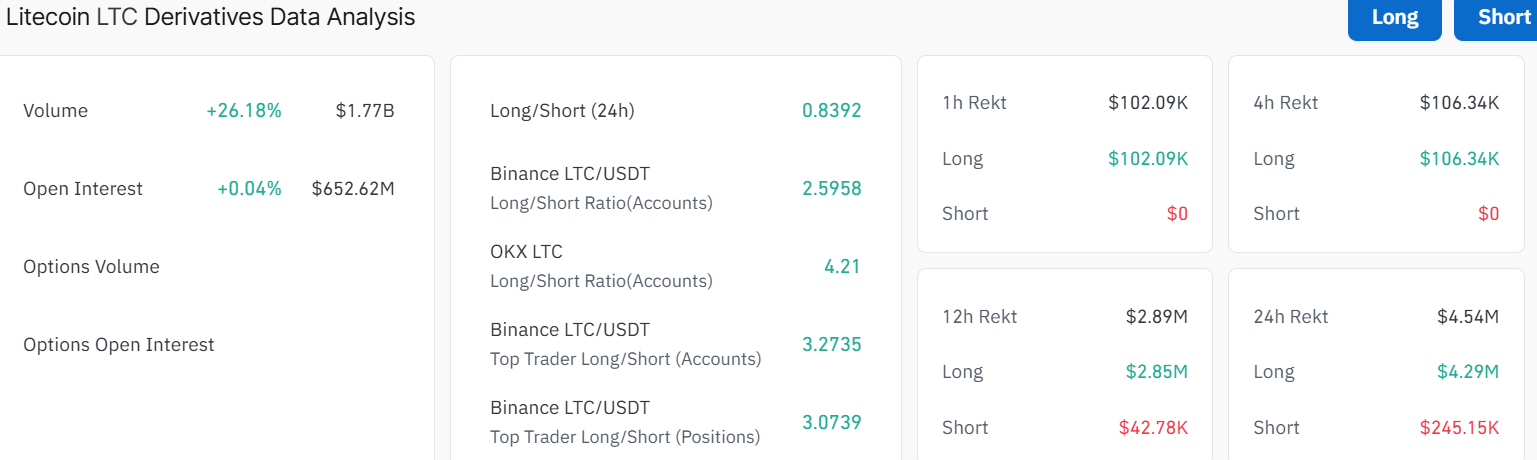
Meanwhile, open interest is up 0.04% to $652.62 million, while trading volume has soared 26% to $1.77 billion. The recent surge in volume shows heightened market activity in the LTC market.
Litecoin Price Risks Further Downside
On the daily chart, LTC/USD is trading at $75.54. The token is trading within a falling wedge, with bulls at risk of further downside. The 50‑day simple moving average (SMA) is sloping down above the price near $79. Notably, the 200‑day SMA is at $99, acting as a long-term resistance level. Meanwhile, as long as the Litecoin price remains below key moving averages, bears may take control and drive the price down.
Momentum indicators are neutral with the Relative Strength Index (RSI) on the daily chart sitting just below the mid‑line near 41.78. This signals that selling has cooled, but buyers have not yet regained control. The MACD is below the signal line, indicating a lack of strong directional bias and a higher likelihood of a larger move once fresh catalysts emerge.
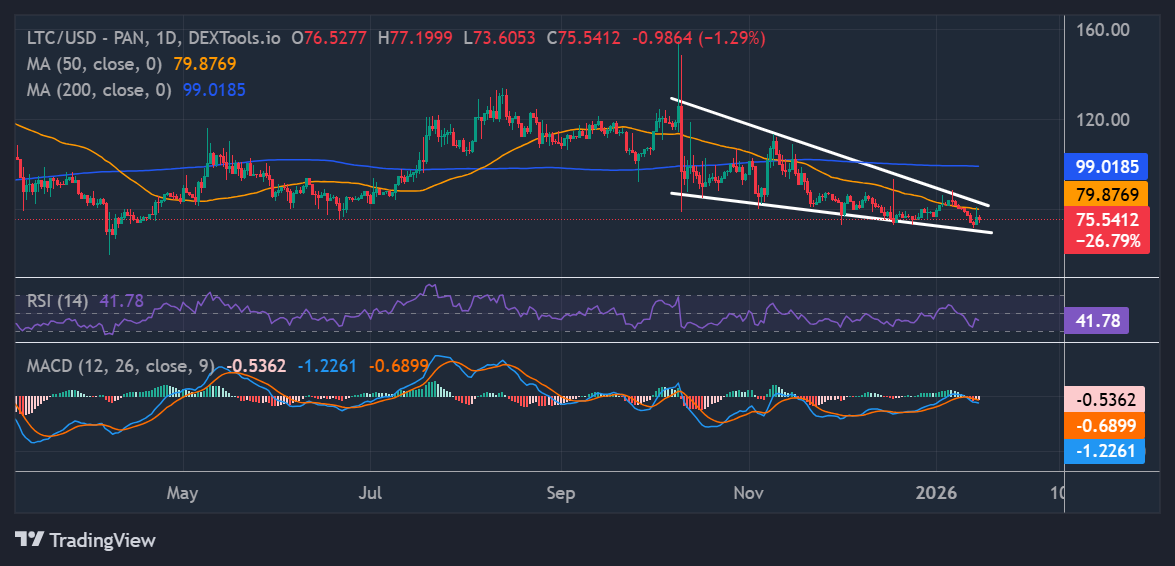
Looking ahead, if bulls defend the current price level and push through the immediate barrier at $79, LTC could recover. A clear breakout above that region would open the door for a move towards the $87-$99 resistance zones.
On the downside, a daily close below $75 would weaken the structure and could trigger a slide toward $73 and then $72, where past demand zones appear on the chart. Overall, the falling wedge pattern and bearish technical indicators suggest further downside in the Litecoin price. Traders should watch for a breakout above $79 as confirmation, which could open the way for a rally toward the $87- $99 range. Until then, bears remain in control, with further correction to $72 in LTC imminent.
![]()
eToro Platform
Best Crypto Exchange
- Over 90 top cryptos to trade
- Regulated by top-tier entities
- User-friendly trading app
- 30+ million users
![]()
eToro is a multi-asset investment platform. The value of your investments may go up or down. Your capital is at risk. Don’t invest unless you’re prepared to lose all the money you invest. This is a high-risk investment, and you should not expect to be protected if something goes wrong.
Advertisement


