

Stacks (STX) price has secured a spot among the top gainers in the crypto market, with its value rising by 10% to trade at $1.87 in the last 24 hours. The price movement is supported by a 24-hour trading volume of 24% to $98 million. Moreover, traders and investors are optimistic about the token, as they suggest an upward movement.
#STX is displaying a bullish trend by consistently bouncing within a rising channel.📈 A breakthrough above the 1.819 mark could send the price soaring towards the next resistance level.🚀#STX #Crypto #Bullish #Stacks #BTC #Bitcoin #JASMY #JasmyCoin pic.twitter.com/PCPsOLiBle
Advertisement
— CryptoRollerCoaster (@__c__r__c__) July 25, 2024

Stacks is a Bitcoin Layer for smart contracts. The project enables smart contracts and decentralized applications to use Bitcoin as an asset and settle transactions on the Bitcoin blockchain.
With the Bitcoin price increasing earlier today, the asset has increased in value and tapped $67,000. Its market cap has soared above $1.320 trillion, as most altcoins, including STX, followed BTC to the green. Moreover, the total crypto market cap has erased almost all losses from yesterday and is above $2.5 trillion.
Stacks Statistical Data
Based on Coinmarketcap data:
- STX price now – $1.87
- STX market cap – $2.76 billion
- STX total supply – 1.81 billion
- STX circulating supply – 1.47 billion
- STX ranking – #32
The Stacks price has formed a rectangle pattern in the four-hour chart timeframe. This pattern often forms when the price of an asset is bound by parallel support and resistance. This marks a consolidation period, indecision between bulls and bears, as they wrestle with neither giving in.
However, the push and pull among the bulls and bears has led to robust support at $1.67 and a limit/resistance at $1.96. The bulls are showing resilience as they have recorded three green candles, which will lead to the STX break above the triangle.
Technical Indicators Emerge Bullish, as Odds Favour the Buyers
Based on the technical outlook, the Relative Strength Index(RSI) is strong at 58, tilting the odds toward the buyers. Moreover, there is potential for upward movement as the token points toward the north. In such a scenario, the RSI may jump toward the 70-overbought zone, reinforcing the bullish outlook.
Notably, the Stacks price trades well above the 50-day SMA (green) and 200-day SMA(blue). With strong support at $1.67, the bulls have notably flipped the 50-day SMA into support at $1.84. This positive outlook could trigger a rally above the rectangle, propelling STX to ATH.
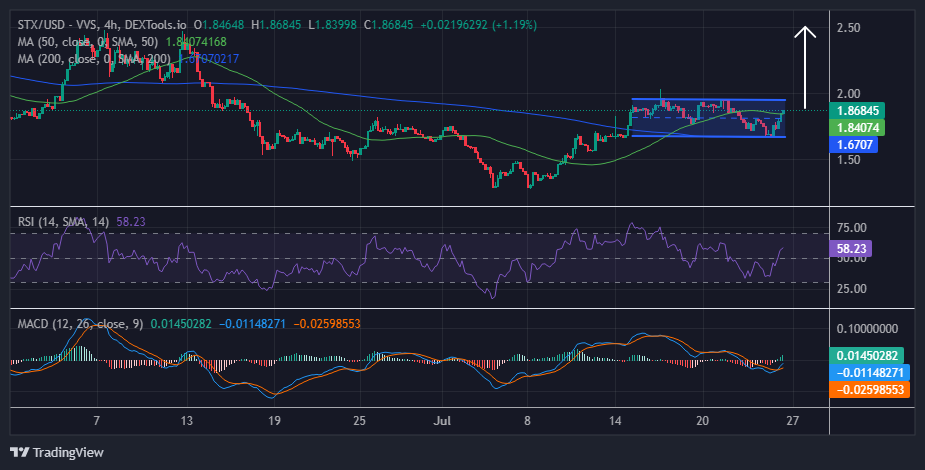
In the same way, the Moving Average Convergence Divergence (MACD) upholds the bullish outlook and hints at the uptrend reaching levels higher than the next resistance at $1.96. The buy signal appeared around July 26, with the blue MACD line crossing above the orange signal line. Traders are inclined to continue buying STX unless the trend in the MACD changes.
STX Bulls Poised for a Breakout as They Eye $2.50
In the 4-hour chart analysis, the odds favor the buyers, as the Stacks price is poised for a break out above the rectangle. If the bulls increase their buying appetite at this level, the Stacks price could rally to $2.50 in the next 48 hours. Conversely, if the sellers step in at this level, they might breach the $1.67 support, invalidating the bullish outlook. In such a case, the Stacks price might retest the $1.56 psychological level.
Advertisement


