


Pepe’s price has soared by 5%, securing a spot among today’s bullish memecoins in the crypto market. According to CoinMarketCap, PEPE is trading at $0.000009425, with its trading volume increasing by 63% to $863 million. Pepe has been stuck in a tight range for several weeks, with the upper limit/resistance at $0.0000099 and the lower limit/support at $0.0000076.
Investor confidence in the token has improved significantly over the last few weeks, especially with support at $0.000008417 holding steady. The most recent rebound also pushed PEPE out of the lower trendline of the descending channel, propping the bullish picture.
Advertisement

Meanwhile, Forbes has revealed the top 10 best-performing cryptocurrencies for the first half of 2024. Pepe is among the top three, alongside WIF and ASI.
Forbes has revealed the top 10 best-performing cryptocurrencies for the first half of 2024. The top three are $WIF, $PEPE, and $ASI.
Here is a quick look at these impressive performers.
For more details, visit:https://t.co/CfoaEL3L2r#Crypto #Forbes #WIF #PEPE #ASI #FLOKI pic.twitter.com/d6c18FDeOV
— MetaverseHub (@Metaverse_Hub) July 15, 2024
Pepe Statistical Data
Based on Coinmarketcap data:
- PEPE price now – $0.000009425
- PEPE market cap – $3.96 billion
- PEPE total supply – 420.69 trillion
- PEPE circulating supply – 420.69 trillion
- PEPE ranking – #25
The Pepe price has been in a downtrend since hitting a new all-time high of around $0.00001723. However, the Pepe price bulls are winning the struggle, as they target to push the token over the upper trendline of the falling channel. Pepe’s technical outlook turned bullish following the token’s rebound from support at $0.000008417.
Pepe Technical Indicators Suggest Dwindling Seller Momentum
After PEPE reclaimed the 50-day Simple Moving Average (SMA) (green), turning it into an immediate support level, the PEPE bulls could recover its ATH 0.00001723. Meanwhile, the $0.00001017, which coincides with the 200-day Simple Moving AverageSMA), acts as the token’s immediate resistance, suppressing the bulls below the upper trendline.
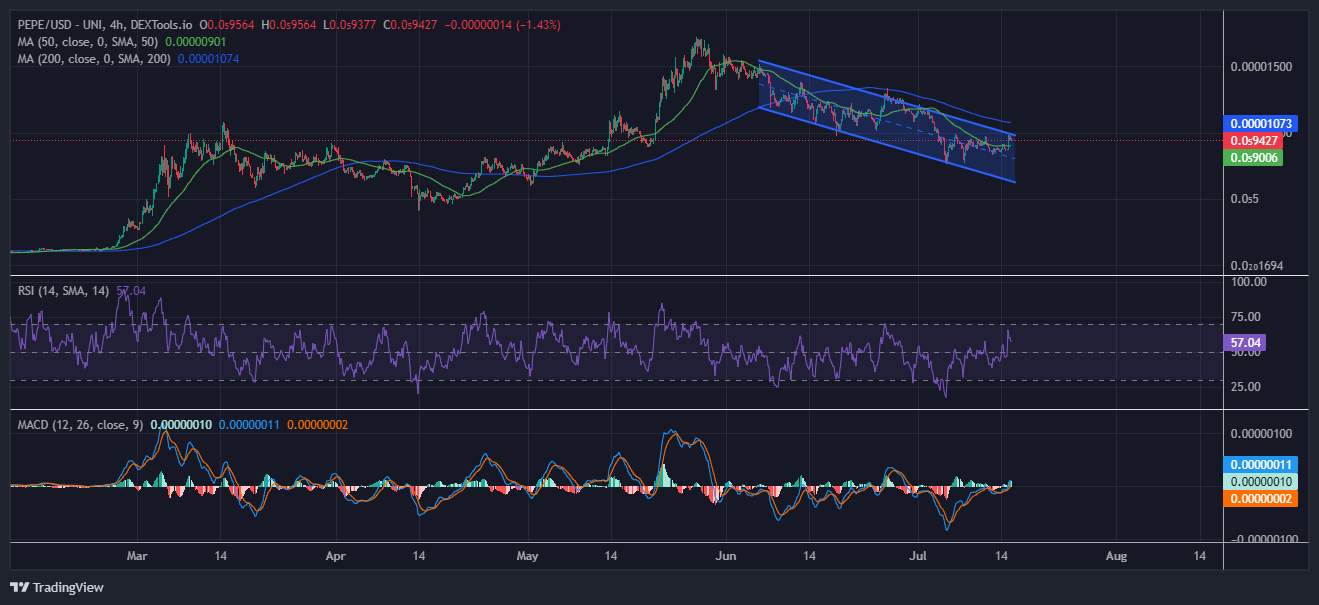
As there are promising signs of a potential recovery within the bearish channel pattern, the Relative Strength Index(RSI) shows its strength at 57. This implies that the bulls have the upper hand. Increased buying pressure could see the token hurtle towards the 70-overbought zone in the coming days.
Moreover, the Moving Average Convergence Divergence (MACD) indicator upholds the bullish outlook and hints at the uptrend reaching levels higher than the resistance at $0.00001017. The buy signal appeared, with the blue MACD line crossing above the red signal line. The cross above the signal line suggests that the short-term moving average rises faster than the long-term moving average. Most traders usually identify this technical occurrence as indicating that the token has entered a short-term positive cycle. Moreover, traders and investors are inclined to continue buying PEPE unless the trend in the MACD changes.
Pepe Price Future Outlook
In the 4-hour chart analysis, Pepe’s price technical outlook suggests that the ongoing upward trend could continue, pushing the price to its ATH. If the price breaks above the channel’s upper trendline, it could enable buyers to challenge the resistance level set by the previous all-time high of $0.00001723, aiming to reach a new peak at $0.00002025.
Conversely, if sellers take control of the market at this level, Pepe’s price could plummet below the channel. In this scenario, the pepe price could sink below the 50-day SMA, at around $0.000008743, invalidating the bullish sentiment in the market. In a dire case, the Pepe price could plunge further, retesting the $0.000007682 support.
Read More
- Next Cryptocurrency to Explode in July 2024
- Crypto Price Predictions
- Best Solana Meme Coins to Buy In 2024
- Australian Court Convicts Ex-Promoter of BitConnect Crypto Ponzi Scheme
- Popcat (SOL) Price Forecast: $1 In the Cards as Popcat Blasts Through Critical Resistance

Advertisement


