Is It Time to Buy SOL? Solana Price Surges 0.5% to New Heights Outpacing Ethereum in Weekly Revenue

Cryptocurrency trading is speculative and your capital is at risk when you trade. We may earn affiliate commissions from some of the products on this page - at no extra cost to you.

The Solana price has surged by 0.5% in the past 24 hours to trade at $183 as of 4:48 a.m. EST. This price jump has also boosted the trading volume, which surged to $3.1 billion within the same period. The Solana blockchain has achieved a historic milestone by outpacing Ethereum in some key metrics. This impressive feat comes amid a surge in network activity, particularly driven by the popularity of meme coins.
Solana’s daily volume suddenly outpaces Ethereum, going over $2 billion – here’s whyhttps://t.co/Zz7TkkJB0K
Advertisement
— John Morgan (@johnmorganFL) July 29, 2024

For the first time, Solana has generated more weekly revenue than Ethereum. According to Blockworks Research, Solana brought in around $25 million for the week of July 22, compared to Ethereum’s $21 million.
Solana has surpassed Ethereum in weekly revenue for the first time, driven by a significant rise in transaction fees and MEV tips. With 58% of the revenue from MEV tips and 37% from priority transaction fees, the growth is mainly attributed to increased decentralized exchanges (DEX) activity.
Solana Price Statistics
- Solana price: $183.3
- Market cap: $85.3 billion
- Trading volume: $3.1 billion
- Circulating supply: 464.9 million
- Total supply: 581.2 million
Solana Bulls Poised for a Bullish Momentum Striving Within the Falling Wedge
Solana’s price is showing promising signs of a bullish rally. Recently, the bulls have regained momentum at the $121.56 support level, driving the price higher. This movement encouraged the bulls to move the price higher, and in turn, they were able to break through the upper trend line of the falling wedge pattern. This increased the chances of a bullish crossover, potentially leading to higher prices.
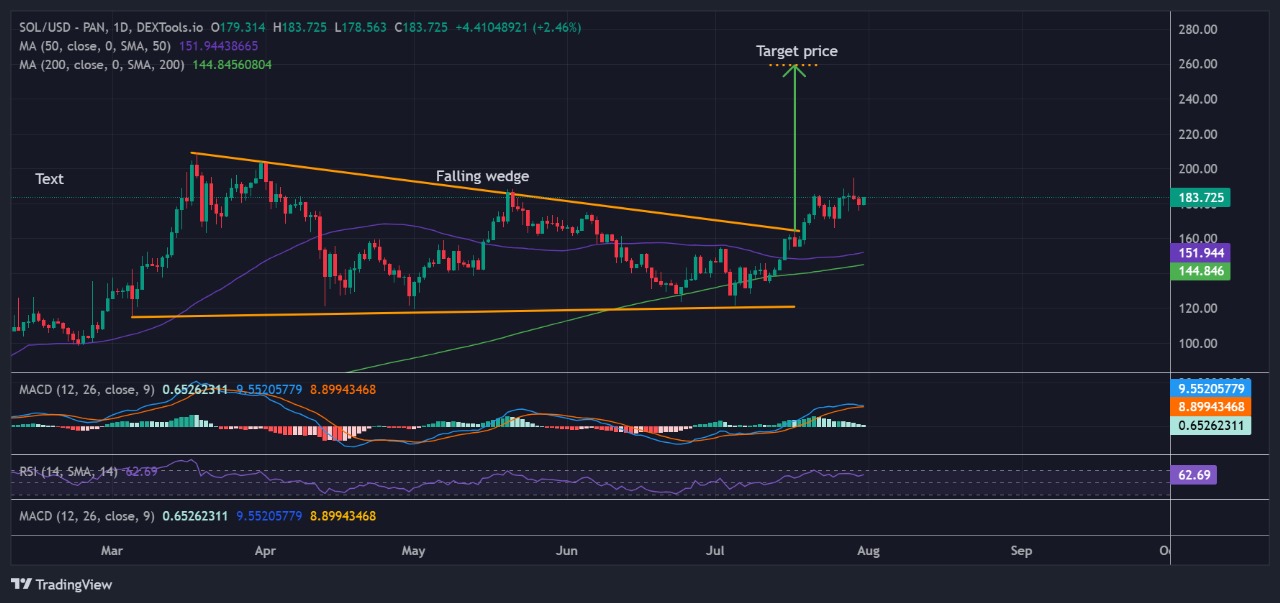
Technical analysis of Solana indicates a strong bullish trend. The market is currently trading above the 50-day and 200-day simple moving averages (SMAs), suggesting that the bulls are in control. If this momentum continues, the distance between the price and these SMAs could widen significantly, benefiting the buyers.
Technical indicators suggest that Solana is poised for a continued upward trend, with the potential for significant gains if the current momentum is maintained. The relative strength index (RSI) also indicates a potential bullish crossover. The RSI is rising above the 50-midline level and heading towards the 70-overbought zone. If this trend persists, Solana might even reach a new all-time high (ATH).
The moving average convergence divergence (MACD) indicator also supports this bullish outlook. The histogram shows increasing green bars, and the blue MACD line has crossed above the orange signal line, reinforcing the likelihood of a bullish crossover.
Solana Price Prediction
Despite the recent downturn forming a falling wedge pattern, there are signs that the bulls are gearing up for a bullish rally. The current support zone has proven to be robust, providing a solid foundation for the bulls to stage a comeback. If the bulls push the price above the falling wedge, it could invalidate the bears’ attempts to drive prices down further. This breakout could set the stage for a significant upward movement, targeting a price of $259.644.
However, the market remains vulnerable to bearish pressure. If the bears overcome the bulls and lower the price, the market could retreat to the $127.048 support level. This level has acted as a crucial support in the past, and its failure could lead to further downside risks.
Learn More
- Next Cryptocurrency to Explode in August 2024
- Ethena Price Prediction 2024 – 2040
- Next 100x Crypto – 12 Promising Coins with Power to 100x
- M2 Exchange Enables UAE Users Trade Crypto Assets Via Banks

Advertisement


