Hedera Price Soars 39% Following Canary Capital’s Spot ETF Filing

Cryptocurrency trading is speculative and your capital is at risk when you trade. We may earn affiliate commissions from some of the products on this page - at no extra cost to you.

Highlights
- Hedera price surged 39% in 24 hours, reaching $0.1119, with trading volume up 118% to $1.5 billion.
- Canary Capital filed for a spot ETF, offering direct exposure to HBAR without derivatives.
- Speculation about U.S. regulatory approval could attract significant institutional investments.
The Hedera (HBAR) price has surged 39% in the last 24 hours to trade at $0.1119 as of 7 a.m. EST on a 118% pump in trading volume to $1.5 billion. The market capitalization now stands at $4.2 billion.
Advertisement

This price jump comes as Canary Capital filed an S-1 registration statement with the SEC for an HBAR spot ETF—a major turn of events in the cryptocurrency arena. Unlike derivative-based ETFs, which draw their valuation from futures or other financial instruments, the proposed ETF would hold HBAR outright, giving investors pure exposure to the token. A step like this underlines growing confidence in Hedera’s potential and is a milestone on the path to wider cryptocurrency adoption in regulated markets.
$HBAR #ETF ETF approval is on the way which could deliver huge institutional adoption and have inflows of BILLIONS in $$ on #Hedera, which could send #HBAR to the moon 🌒 Well to $1 – 1.50c to a maximum in this cycle of a 25 X ($2.50c) Don’t fall asleep at the wheel – ETF is… pic.twitter.com/6AiGg39HRY
— Crypto Fun Guy (@cu23075334) November 18, 2024
This filing comes amid growing speculation that the current US administration may be more open to approving cryptocurrency spot ETFs, which could be a dam-breaking event that floods the markets with institutional investments.
If approved, this would further cement HBAR’s market position, increasing demand for the native token and the overall value of the Hedera network. This regulatory momentum, in combination with growing institutional interest, has lit the fuse among investors and sent the price of HBAR to its current highs.
HBAR Statistics
- HBAR price: $0.1119
- Market capitalization: $4.2 billion
- Trading volume: $1.5 billion
- Circulating supply: 37 billion
- Total supply: 50 billion
Hedera Price Explosive Breakout: A Bullish Revival
After weeks of extremely tight consolidation between $0.04 and $0.05, Hedera has just now broken out with a phenomenal upsurge. After the accumulation phase, the price went into an explosive rally and reached a high of 0.11, representing a phenomenal one-day gain of 22.46%. This was not an anomaly surge since the movement clearly marked a shift in the market because HBAR slashed through key resistance points.
The price surged above its 50-day moving average of $0.069 and the 200-day moving average of $0.054, previously acting as a barrier against any more rallies. Once an obstacle for upward momentum, these levels now become key support zones that indicate the cautious building of bullish sentiment.
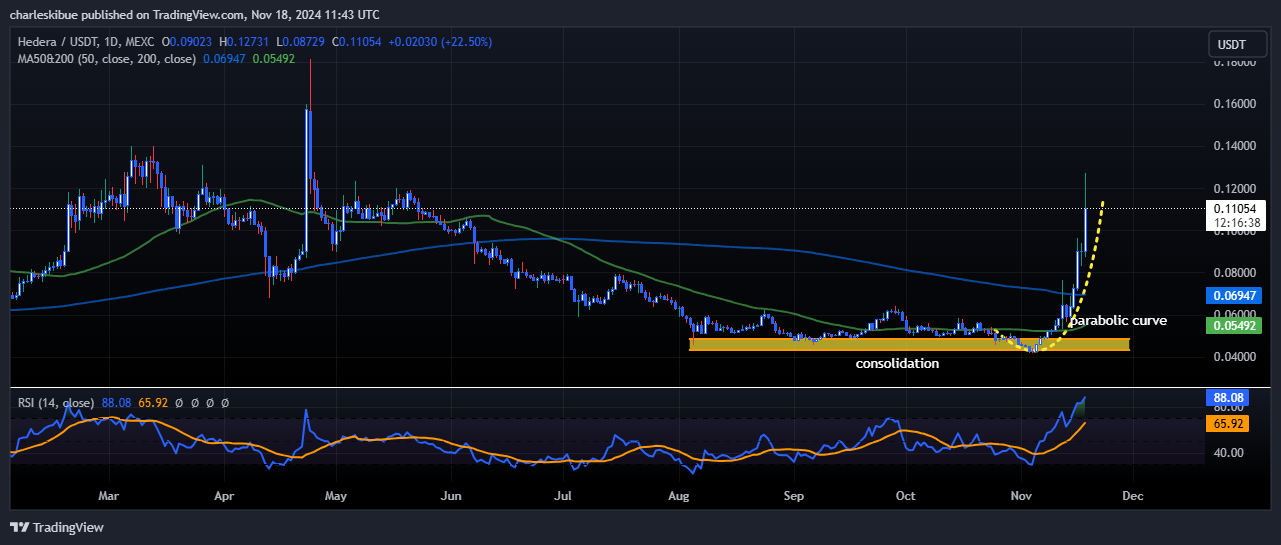
Despite the explosive rally, caution is warranted. The RSI has shot to an extremely high 88.08, which indicates that HBAR is highly overbought and might be due for a breather. In case the momentum still persists, the next big resistance could very well lie at $0.12, but of course, there’s also the possibility that the price could pull back to test key support levels. A retest to $0.08 or even the 50-day moving average can afford an opportunity for more accumulation before the next leg up.
What’s more, the possible formation of a golden cross – when the 50-day moving average crosses over the 200-day moving average looms on the horizon, a bullish signal suggesting a longer-term uptrend may be in the works. These are the levels that the investor and the trader should carefully watch while preparing for price action whenever indications of momentum shifts come up.
Advertisement


