Ethereum Price Surges as ETH ETFs Record Positive Inflows

Cryptocurrency trading is speculative and your capital is at risk when you trade. We may earn affiliate commissions from some of the products on this page - at no extra cost to you.

The Ethereum price has exited the red zone, surging almost 1% in the past 24 hours, with the ETH/USD at $2,554. However, its 24-hour trading volume has plunged 26% to $16 million. ETH has escaped lightly in relation to other coins, with the market now down by almost 1% today. However, the alt remains down, suffering a 3.35% loss in a week and a 24% decrease in a month.
The second-largest crypto has retained a 54% increase in the past year. Meanwhile, Ethereum (ETH) Exchange-Traded Funds (ETFs) recorded inflows in August 28 data, ending a nine-day outflow trend.
Advertisement

After two weeks, we’re finally seeing positive inflows in the $ETH ETF.
On the same day, $ETH outperformed Bitcoin with a 4% gain. 📈 #crypto #Ethereum pic.twitter.com/hZet1qRh2V
— Conor Kenny (@conorfkenny) August 29, 2024
Ethereum Statistical Data
Based on CoinmarketCap data:
- ETH price now – $2,554
- ETH market cap – $307 billion
- ETH total supply – 120 million
- ETH circulating supply – 120 million
- ETH ranking – #2
Will the Bulls Break Above the Falling Wedge?
The Ethereum price trades within a falling wedge as the bulls struggle to reclaim the $3,000 mark. On August 24, the ETH price attempted a rally; however, the bulls faced strong resistance at $2,817. This caused the ETH price to fall like a dead weight in the air, with the bulls finding strong support at $2,441, defending against further downward movement.
There is a tug-of-war between the bulls and the bears, tussling to take control of the market. The Ethereum price trades below the key technical indicators, tilting the odds in favor of the bears. To start with, the ETH price trades below the 50-day and 200-day Simple Moving Averages(SMAs). In this case, the bulls must conquer the $2,654 and $2,755 resistance keys before they resume an uptrend, which might see the ETH price reclaim the $3,0000 mark.
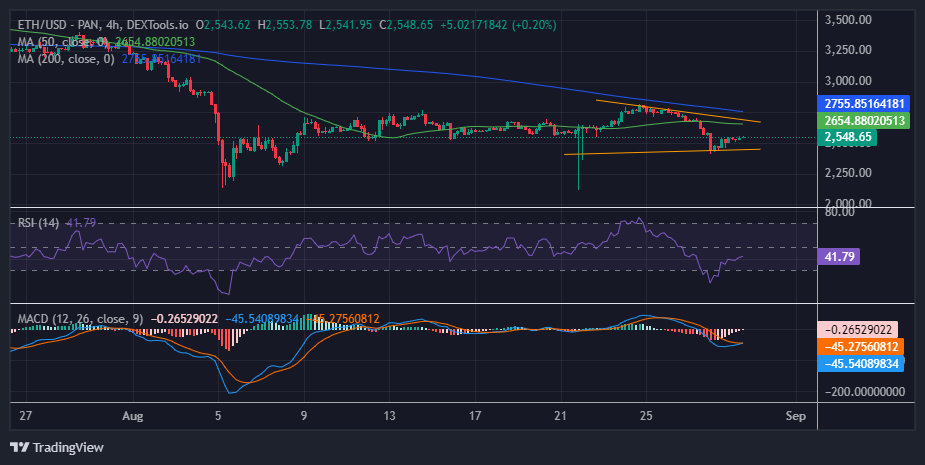
Moreover, the bulls are showing momentum with the confirmation of the Relative Strength Index. The RSI in the ETH market has hurtled from the 30-oversold zone, currently sitting at 41. Continued buying appetite will see the RSI climb above the 50-mean level to the 70-overbought zone, suggesting a bullish sentiment.
On the other hand, the Moving Average Convergence Divergence (MACD) is moving to cross above the signal line. If this happens, the ETH market momentum will shift from bearish to bullish, calling for traders to rally behind ETH.
Ethereum Price Outlook
The 4-hour chart above shows a tug-of-war between buyers and sellers; however, the odds lean toward the downside. With the bulls putting up a fight in the ETH market, the ETH price could soon reclaim the $3,000 mark. Meanwhile, a breach and close above the 50-day SMA at $2,654 will validate a bullish thesis.
On the other hand, Ethereum price sits below the 50-day and 200-day Simple Moving Average (SMAs). Sellers have the upper hand, motivated by the Relative Strength Index (RSI) retracement in the neutral region to 41. Should the RSI drop toward the oversold region, ETH will overshoot short-term support at $2,400, advancing to seek liquidity.
Bottom Line
The Ethereum price analysis suggests that a trend reversal is highly likely as long support at $2,441 holds. Moreover, if validated, the falling wedge in the 4-hour chart range promises a 6.08% breakout to $2,654.
A falling wedge is a bullish reversal pattern validated by a breach of the trend line resistance. Traders will place buy orders above the breakout point and set the stop loss below the trend line. A rapid increase in trading volume will increase confidence in the upward trajectory of the ETH price.
Advertisement


