Ethereum Price Forecast: More Downside Expected as the Bears Eye $2,917

Cryptocurrency trading is speculative and your capital is at risk when you trade. We may earn affiliate commissions from some of the products on this page - at no extra cost to you.

The Ethereum price has plummeted 2% today, with the ETH/USD trading at $3,133. The altcoin remains suppressed in the red zone, slumping 2% in the past week and 8% in the past month. However, it has recorded a significant pump, surging 71% in a year.
Despite the sharp price decline, its 24-hour trading volume is up 1% to $19 billion. Meanwhile, data from Coinalyze shows Ethereum open interest (OI) dropped 2.09% in the last 24 hours. Open interest signals the total open contracts on an asset, increasing when a new contract, whether Long or Short, is added. However, fused with the decreasing price, it signals that the ETH price may drop even further.
Advertisement


Despite the speculations, institutional demand for ETH is increasing. This comes as Ethereum ETFs recorded net inflows of $33.7 million at the end of July. Moreover, BlackRock ETF, a global investment manager and technology provider, saw around $118 million in inflows. These inflows suggest growing institutional interest despite the bearish outlook in the ETH market.
#Ethereum ETFs had a net inflow of $33,700,000.
BlackRock bought $118,000,000 $ETH.
ETH is just getting started, my bags are ready 🚀 pic.twitter.com/OofFXPuLf7
— Ted (@TedPillows) July 31, 2024
Ethereum Statistical Data
Based on Coinmarketcap data:
- ETH price now – $3,133
- ETH market cap – $365.2 billion
- ETH total supply – 120.25 million
- ETH circulating supply – 120.25 million
- ETH ranking – #2
Ethereum Price Technical Indicators Emerge Bearish: Is More Downside Coming?
The Ethereum price has flipped bearishly, trading slightly below the falling wedge. However, if the sellers dominate at this level, the Ethereum price could slump towards the $2,917 mark. Looking at the technical outlook, the bears show no signs of slowing down, as two moving averages have formed a death cross. The Ethereum price trades below the 50-day in green and 200-day in blue (Simple Moving Averages). In this case, the $3,251 and $3,270 are the immediate resistance keys, cushioning the bulls against an upward trajectory.
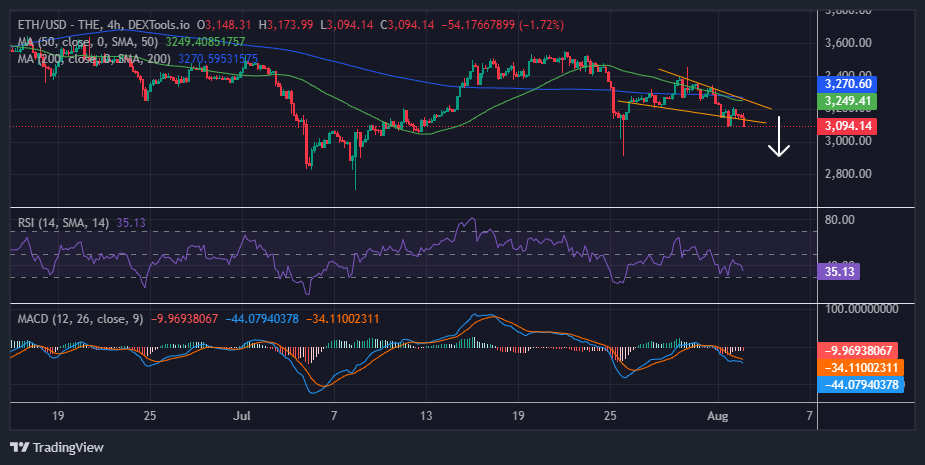
Moreover, the Relative Strength Index (RSI) is below the 50-mean level, suggesting dwindling buyer momentum. Currently, the RSI sits at 38. If the bears show resilience at this level, the altcoin could hurtle toward the 30-oversold level, which could see the ETH price at $2,917.
In the same way, the Moving Average Convergence Divergence (MACD) worsens the outlook, as it rests in the negative territory. Notably, the MACD indicator in blue has crossed below the signal line in orange, accentuating the bearish outlook. Meanwhile, traders and investors are inclined to sell ETH unless the MACD changes.
Ethereum Price Future Outlook
The Ethereum price in the 4-hour chart analysis favors the downside. Moreover, if the sellers capitalize on the death cross at $3,284, the price of Ethereum could drop further. With the formation of a falling wedge pattern, more downside is expected as the price may fall to the $3,027 support zone.
Moreover, the technical indicators for Ethereum are bearish and may push the price further downwards to around $2,917. On the other hand, if the buyers step in, the ETH price could surpass the 3,388 technical barriers. In a highly bullish case, the bulls might flip the 50-day SAM into support, propelling the price to $3,553.
Learn More
- Next Cryptocurrency to Explode in August 2024
- Ethena Price Prediction 2024 – 2040
- Next 100x Crypto – 12 Promising Coins with Power to 100x
- Will XRP and Solana Experience August Rallies? Analytical Platform Explains

Advertisement


