Cardano Price Pumps as Whale Activities Surge – What Next for ADA?

Cryptocurrency trading is speculative and your capital is at risk when you trade. We may earn affiliate commissions from some of the products on this page - at no extra cost to you.

Highlights:
- Cardano Price surges 15% to $0.43 for the first time since July.
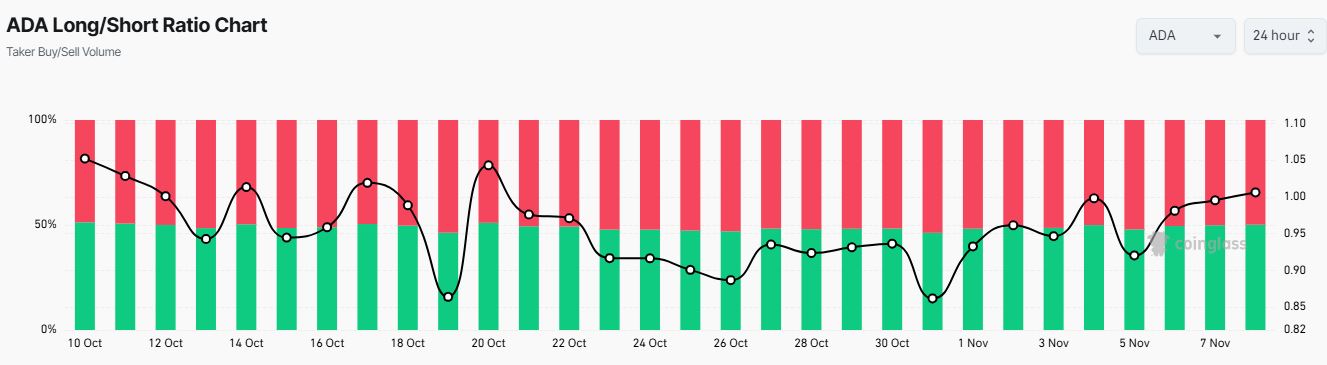
- On-chain metrics suggest intense bullish sentiment as the ADA Long/Short ratio flips above 1.
- With the Golden Cross in the ADA market, will the bulls reach the $5 mark in the short term?
The Cardano price is winning on the charts, as it has surged 15% to trade at $0.4264 on Friday, Nov 8, during the European trading sessions. Its daily trading volume has notably skyrocketed over 130% to $990 million, suggesting a rise in market activity. ADA has now jumped to the green zone, boasting a 24% increase in a week, 24% in a month, and 19% in a year.
Advertisement

Meanwhile, Cardano topped $0.43 for the first time since July. This shows that whale activity is intense, with 697 ADA whale transactions >$100,000 and 37,892 unique address transactions—highs since September 4, as per Cryptolens news.
#ADA Santiment: Cardano topped $0.43 for the first time since July. Activity is strong, with 697 ADA whale transactions >$100,000 and 37,892 unique address transactions – highs since September 4. pic.twitter.com/IKj7T17ryP
— CryptoLens.News (@cryptolens_news) November 8, 2024
Other on-chain metrics show some hope for ADA’s price outlook. ADA’s long-to-short ratio is around 1.01 flipping above the neutral level of 1 since October 20, CoinGlass data shows. This signals increased investor confidence which might result in a good movement to the upper zones.
Cardano Statistical Data
Based on CoinmarketCap data:
- ADA price now – $0.4264
- Trading volume (24h) – $990.58 million
- Market cap – $14.92 billion
- Total supply – 44.99 billion
- Circulating supply – 35 billion
- ADA ranking – #8
Cardano Price Skyrockets in a Parabolic Curve
Cardano has made an excellent upward movement, thanks to the US Election, which broke the local resistance zone at $0.3640. The ADA/USD price action in a 4-hour timeframe highlights a rapid surge in bullish momentum. Initially, the token experienced a period of consolidation, moving sideways, indicating a balance between buying and selling forces.
However, following reports of Trump’s victory as the 47th president of the U.S., bulls have sprung into action to engineer a big bounce for ADA. ADA has broken out in a parabolic curve, printing green candlesticks with the wick touching $0.4418.
At press time, ADA sits on top of confluence support, strengthened by key bullish indicators on the charts, starting with the 50-day Moving Average (MA) (green) and the 200-day MA (blue). In this case, the $0.3506 and $0.3529 act as immediate support levels, steadying the market’s uptrend.
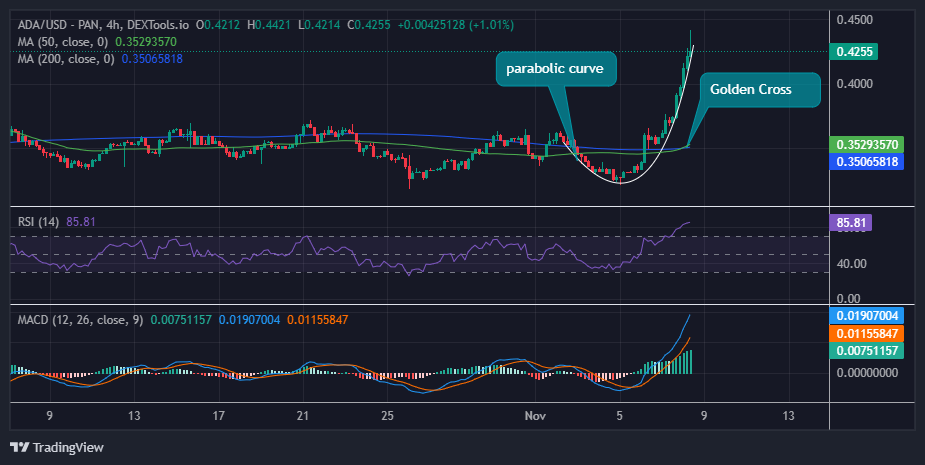
However, the Relative Strength Index (RSI) cautions traders of a potential correction. After climbing from support at the mid-line (50), the RSI jumped into the overbought area, hitting the 85.81 strength level. Traders won’t have to worry about sudden pullbacks with the RSI above 70, as this position also means a correction is imminent.
The Moving Average Convergence Divergence also calls for traders to rally behind ADA. Its position above the neutral area in the positive region and the increase in the size of the green histograms suggest intense buying strength. Moreover, the blue MACD line has crossed above the orange signal line, validating the bullish sentiment.
How High Can ADA Go?
The bulls are currently in full control of the Cardano market, quashing their seller congestion. However, traders are advised to be cautious as the RSI roams around the overbought region. A retracement will likely follow to allow ADA to sweep through more liquidity as already sidelined investors rush to buy lower-priced Cardano tokens.
For now, all eyes are on the immediate support at $0.3640, as a pullback will see the bulls chase that support level. In the meantime, if the Bulls capitalize on the Golden Cross, an increased buying appetite will see the Cardano price at $0.5 or above the $0.68 mark.
Advertisement


