Cardano Price Outlook: ADA Rebounds 5% as Bullish Sentiment Builds

Cryptocurrency trading is speculative and your capital is at risk when you trade. We may earn affiliate commissions from some of the products on this page - at no extra cost to you.

Highlights:
- Cardano price rebounds 5% to $0.60, as its trading volume spikes 38%.
- On-chain metrics signal intense whale accumulation, showing renewed investor interest.
- The technical outlook suggests a potential bullish reversal as bearish momentum wanes.
The Cardano price is showing signs of life, as it has rebounded 5% to $0.60 mark. The daily trading volume is notably up 38% indicating heightened market activity. On-chain metrics moving towards increased accumulation by whales and greater social dominance are a sign that investor confidence is being restored. Technical indicators imply a decline in bearish momentum, suggesting a possible bullish reversal soon.
Advertisement

ADA On-Chain Metrics Outlook
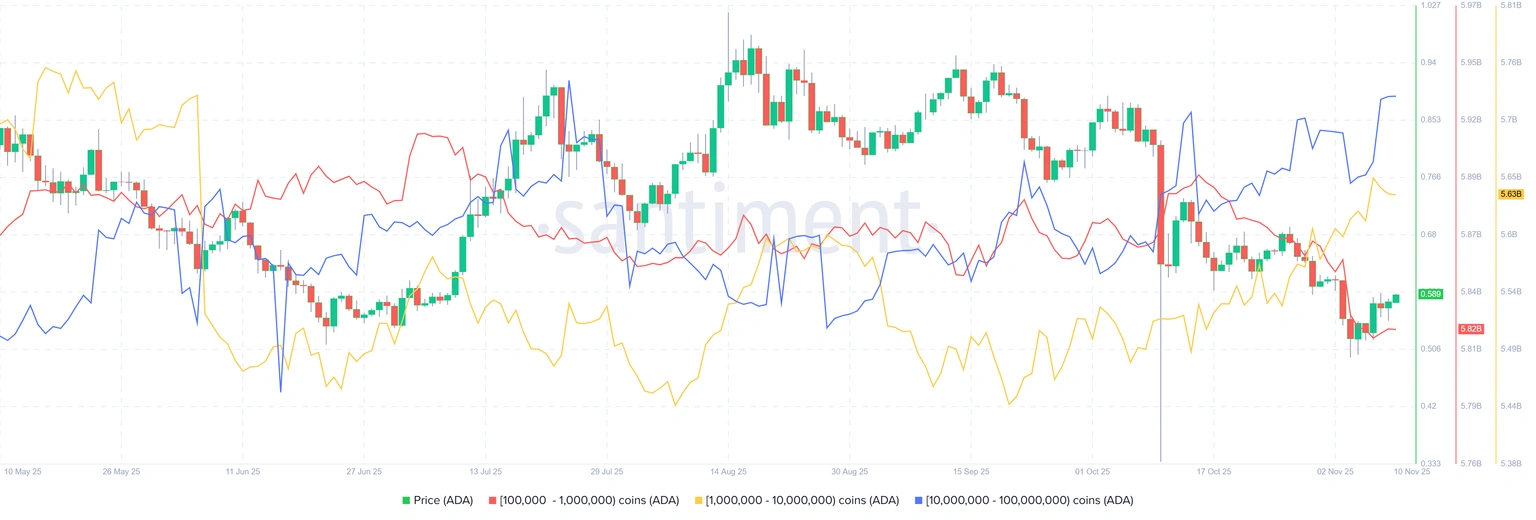
The Supply Distribution data released by Santiment backs a positive trend in Cardano. This comes as specific whales that purchased ADA during the recent price drops. The metric shows that the number of whales with between 1 million and 10 million ADA tokens (yellow line) and 10 million and 100 million tokens (blue line) has earned a total of 160 million ADA tokens between Thursday and Monday. This demonstrates that this group of whales took advantage of the discount and amassed Cardano.
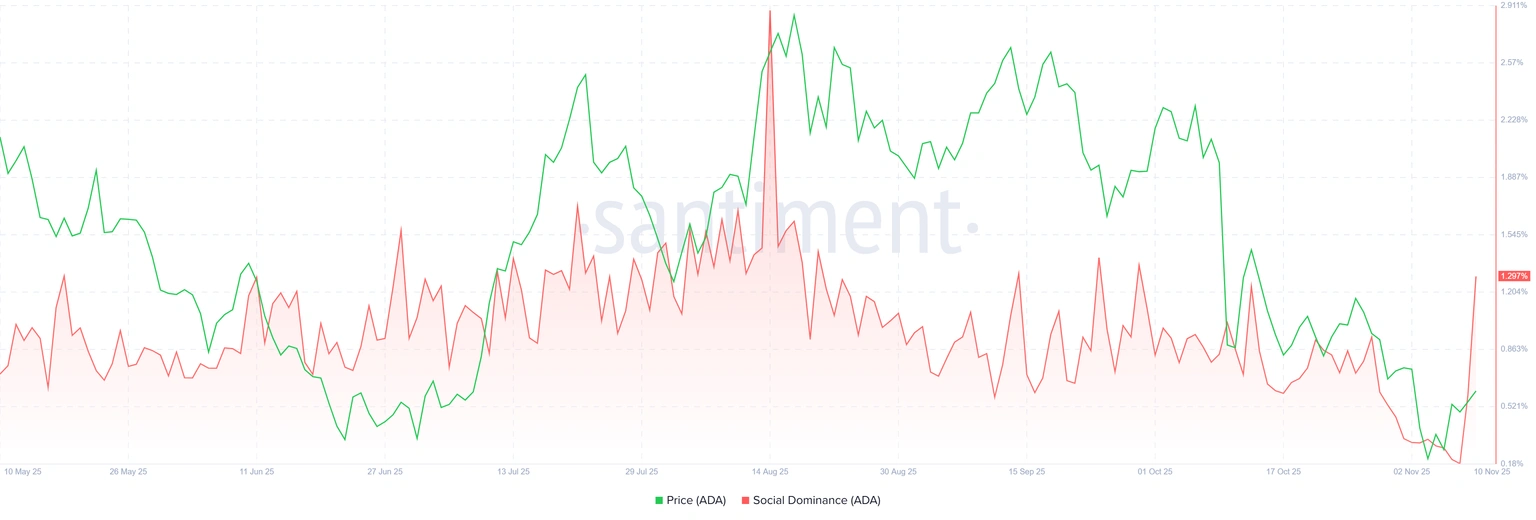
The Social Dominance metric of Santiment on Cardano also indicates a buyer-friendly future. The index is a percentage of ADA-related discourse in the cryptocurrency realm. On Monday, it increased to 1.29% up from 0.18% on Saturday, the highest level since the end of September. This increase reflects the interest of a larger number of investors and greater attention to Cardano.
Cardano Price Rebounds as Bulls Eye $0.69 Barrier
The ADA/USDT price chart shows the green 50-day Simple Moving Average (SMA) trending upward, serving as a trusty resistance line above $0.69. Cardano’s price has been bouncing off these levels before breaking out on October 10 in a huge spike, showing serious bullish vibes.
However, aggressive profit-taking kicked in, pushing the price back to the top of the range within a steady falling wedge. Caradno is currently testing the upper channel resistance line around $0.60, and if it breaks through, we could see a legit pump to $0.69.
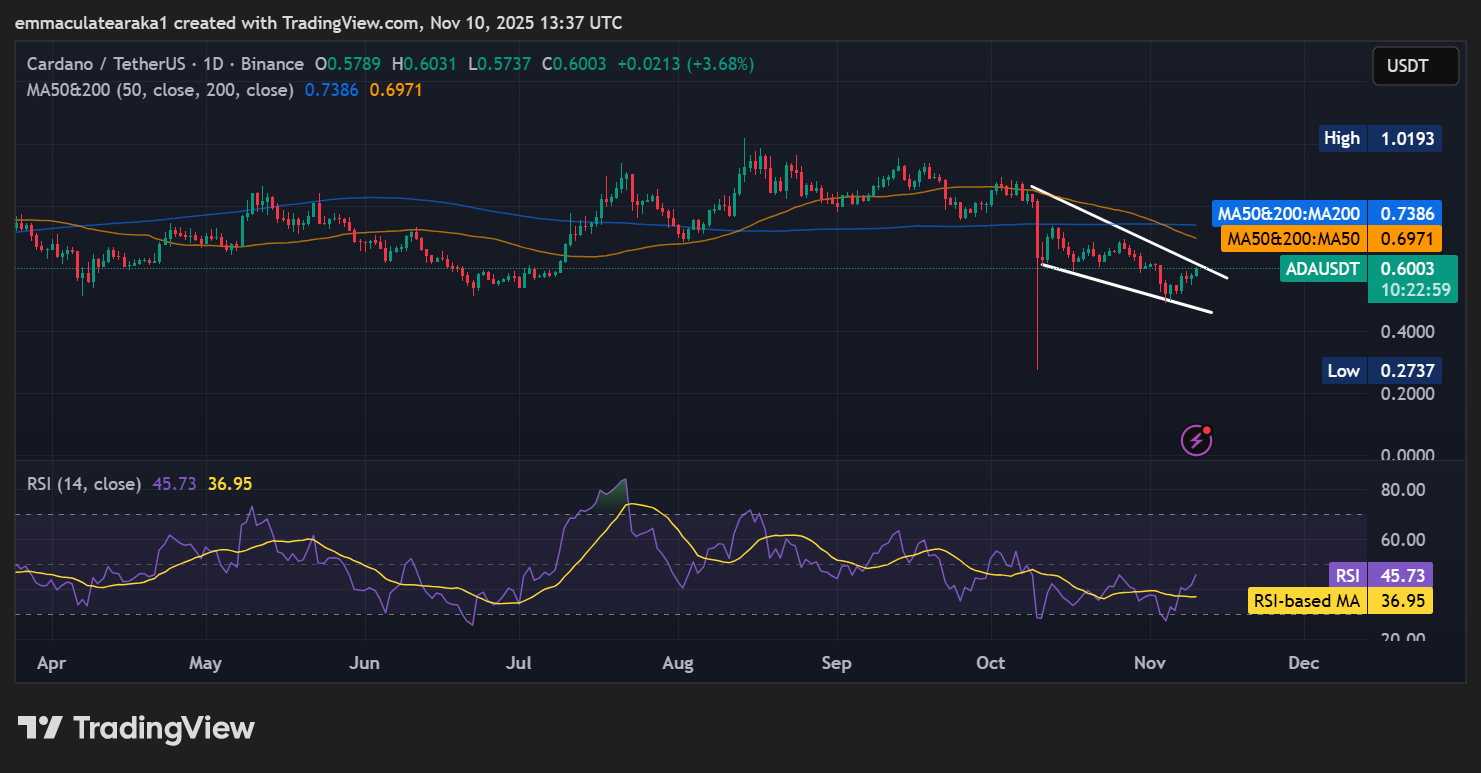
Digging into the indicators, the Relative Strength Index (RSI) is hovering at 45.73, a neutral ground. However, it’s creeping up from near-oversold territory, suggesting potential for a higher peak.
While falling wedge patterns are bullish breakout patterns, when the price is rejected at the trendline resistance, the downside can be brutal. For instance, if Cardano’s price crashes 31% after being rejected at the descending trendline around $0.69, we could see a dip back to $0.61 support or lower.
Looking ahead, Cardano’s price could surge to $0.69 within the next week, with the potential to hit $1.00 if the $ 0.73 resistance gives way. However, in the long term, if Cardano’s price maintains its rebound momentum and the community stays hyped, we might see $1.15 by the end of Q4. In the meantime, traders should be cautious of a potential pullback if that resistance(50-day SMA) rejects the price.
![]()
eToro Platform
Best Crypto Exchange
- Over 90 top cryptos to trade
- Regulated by top-tier entities
- User-friendly trading app
- 30+ million users
![]()
eToro is a multi-asset investment platform. The value of your investments may go up or down. Your capital is at risk. Don’t invest unless you’re prepared to lose all the money you invest. This is a high-risk investment, and you should not expect to be protected if something goes wrong.
Advertisement


