


Highlights:
- Zora price surges 35% to $0.1294, as trading volume spikes 109%.
- Zora’s technical indicators show a short-term retracement, as overbought conditions emerge.
- In the short term, a 10-20% drop could be imminent to allow the bulls to sweep through liquidity.
The Zora has hit an All-Time high of $0.1434, before retracing to $0.1294, marking 35% gains. Its trading volume has risen 109% to $304 million, indicating intense investor confidence. An explosion in trading volume is reported as Binance introduced 50x perpetual futures on Zora, which boosted the trading volume.
Advertisement

$ZORA hits an all-time high, rising 1460% in the last month amid a surge in user activity. 🚀
Daily trading volume hit $340.3 million, up 100.2%, with #Coinbase leading at 27.23% of total activity.#ZORA breakout confirmed. Structure mirrors the last 533% rally at $0.33549… pic.twitter.com/dezF6MffGr
— Coinpedia Markets (@MarketCoinpedia) August 11, 2025
Moreover, the minting activity of Zora has been stable, and there are more than 2 million new coins have been minted this month alone. This means that there is increased confidence among users within the ecosystem, further boosting the bullish trend of the token. The other important catalyst for the rise of Zora is the whale activity. During the last week, a 16% rise in the assets was observed, which means that the current sum of the whale assets is $33.9 million. It demonstrates that big investors are planning to profit as Zora grows, which contributes to strengthening the price activity of a token in the short run.
Zora Price Hits a New ATH as Volume and OI Spike
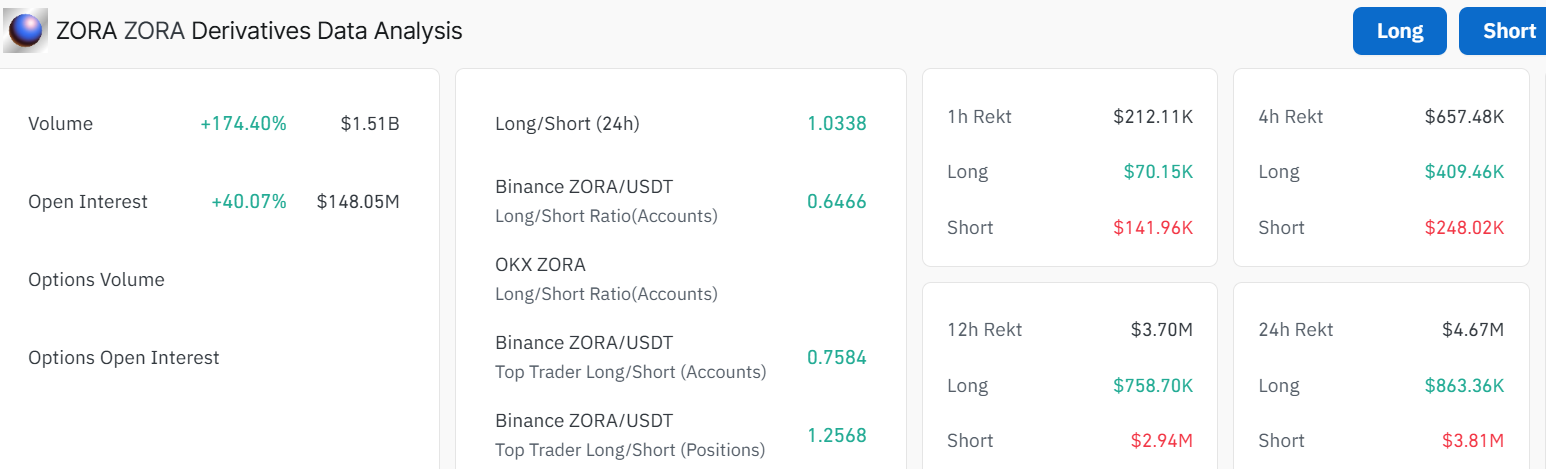
Besides, the data on the volume and open interest in the derivatives market in Zora has soared. The chart reveals that the trading volume of Zora has shot up by 174.40% to $1.51billion. The open interest has grown by 40.07% to reach $148.05 million, which is a hint that more are betting on the potential of Zora. The derivatives market operated by Zora is also recording more long-to-short ratios(1.0338). This means that many traders are opening long positions, anticipating an increased price in the future.
In the 4-hour chart outlook, Zora price trades well within the confines of a rising parallel channel. Meanwhile, in June, ZORA was trading sideways around $0.007 to $0.009. Then July hit, and things got volatile as the price exploded upward, breaking through multiple resistance lines. The bulls have established strong support around $0.07760 (50-day SMA and $0.04690(200-day SMA).
Meanwhile, the Relative Strength Index (RSI) is sitting at 76.07, which is overbought territory. This means ZORA’s been running hot and might see a quick breather or undergo a pullback to cool off. This could push the price back to support around $0.10 or even $0.098 if sellers overwhelm buyers.
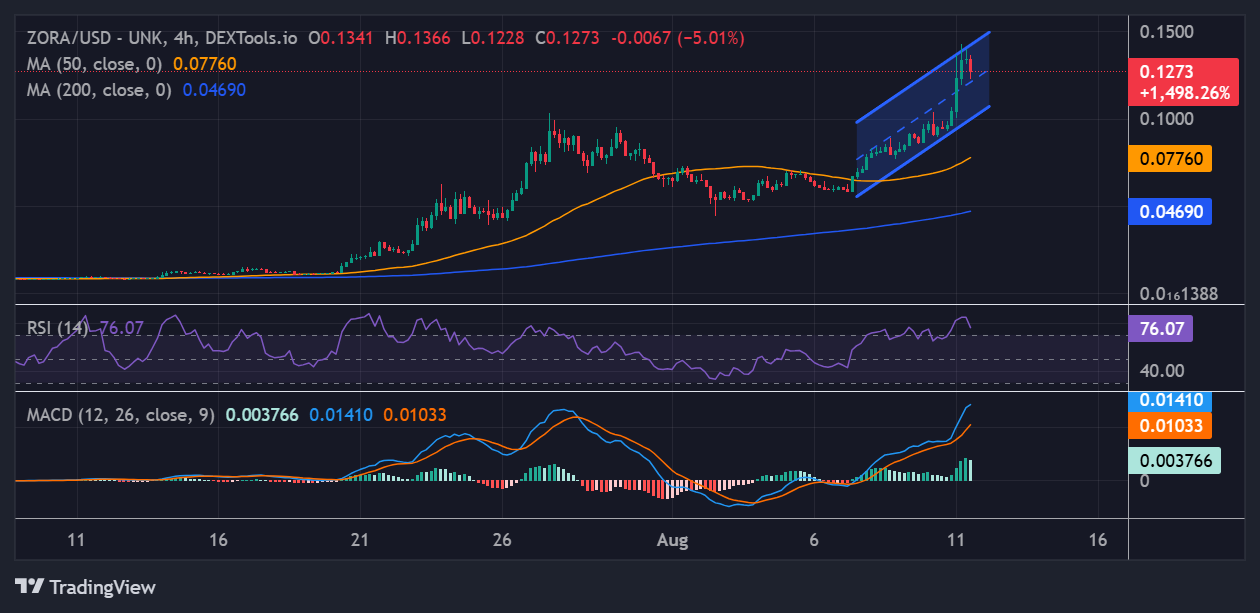
In addition, the Moving Average Convergence Divergence (MACD) has registered an upward change, where the MACD line cuts above the signal line. This further supports the bullish theme in the Zora market.
ZORA Poised for a Slight Pullback Before a Substantial Leg Up
In the short term, traders can expect some volatility. With the RSI overheated, ZORA could retrace 10-20% to $0.10-$0.098 in the next week or two, testing key support zones. Conversely, if volume stays strong and no major dumps happen, Zora’s price might bounce hard. Mid-term, by the end of September, the asset may hit $0.20, assuming BTC doesn’t tank. In the long term, if this breakout sticks, ZORA could eye $0.39 or higher by Q4 2025. However, the overbought RSI level means flash crashes are possible, so traders should keep an eye on key support zones.
![]()
eToro Platform
Best Crypto Exchange
- Over 90 top cryptos to trade
- Regulated by top-tier entities
- User-friendly trading app
- 30+ million users
![]()
eToro is a multi-asset investment platform. The value of your investments may go up or down. Your capital is at risk. Don’t invest unless you’re prepared to lose all the money you invest. This is a high-risk investment, and you should not expect to be protected if something goes wrong.
Advertisement


